Ad Debugger
The Ad Debugger provides detailed diagnostic information for troubleshooting ad integration issues.
Ad Debugger is available starting from SDK 8.20.0.
Getting Started
Opening the Ad Debugger
Activate the Ad Debugger by long-pressing any ad view with three fingers for 3 seconds.
On the Simulator, a two-finger long-press for 2 seconds is sufficient.
Note that to inspect an ad that failed to render, you must open the Ad Debugger through a different ad view.
Force-Enabling the Ad Debugger
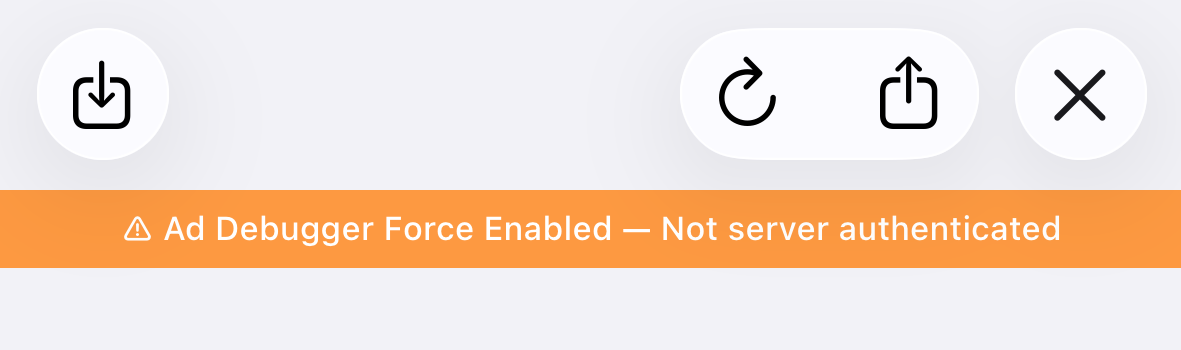
Force-enabling bypasses server authentication and is intended for development and internal testing only. A warning banner will be displayed inside the Ad Debugger when force-enabled.
Force Enable
To force-enable the Ad Debugger in your app, configure GFPAdManager as follows:
- Swift
- Objective-C
GFPAdManager.setAdDebuggerEnabled(true)
[GFPAdManager setAdDebuggerEnabled:YES];
Force Open
You can also open the Ad Debugger programmatically without a gesture:
- Swift
- Objective-C
GFPAdDebugger.forceOpenAdDebugger()
[GFPAdDebugger forceOpenAdDebugger];
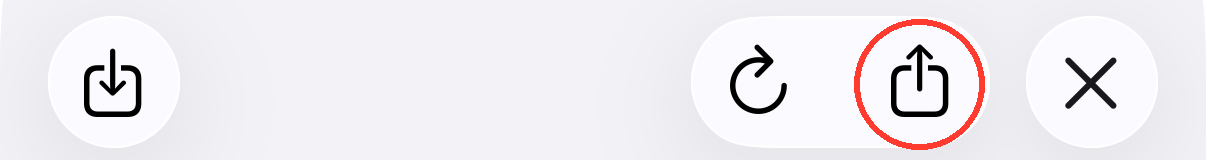
Exporting Logs
Tap the share button in the top-right corner to export the Ad Debugger data as a .zip file. You can attach this file when filing support requests.
Ad Logs
View ad analysis, API request/response history, event logs, and parameter configurations.
For memory efficiency, only the most recent ads up to a specified limit are shown.
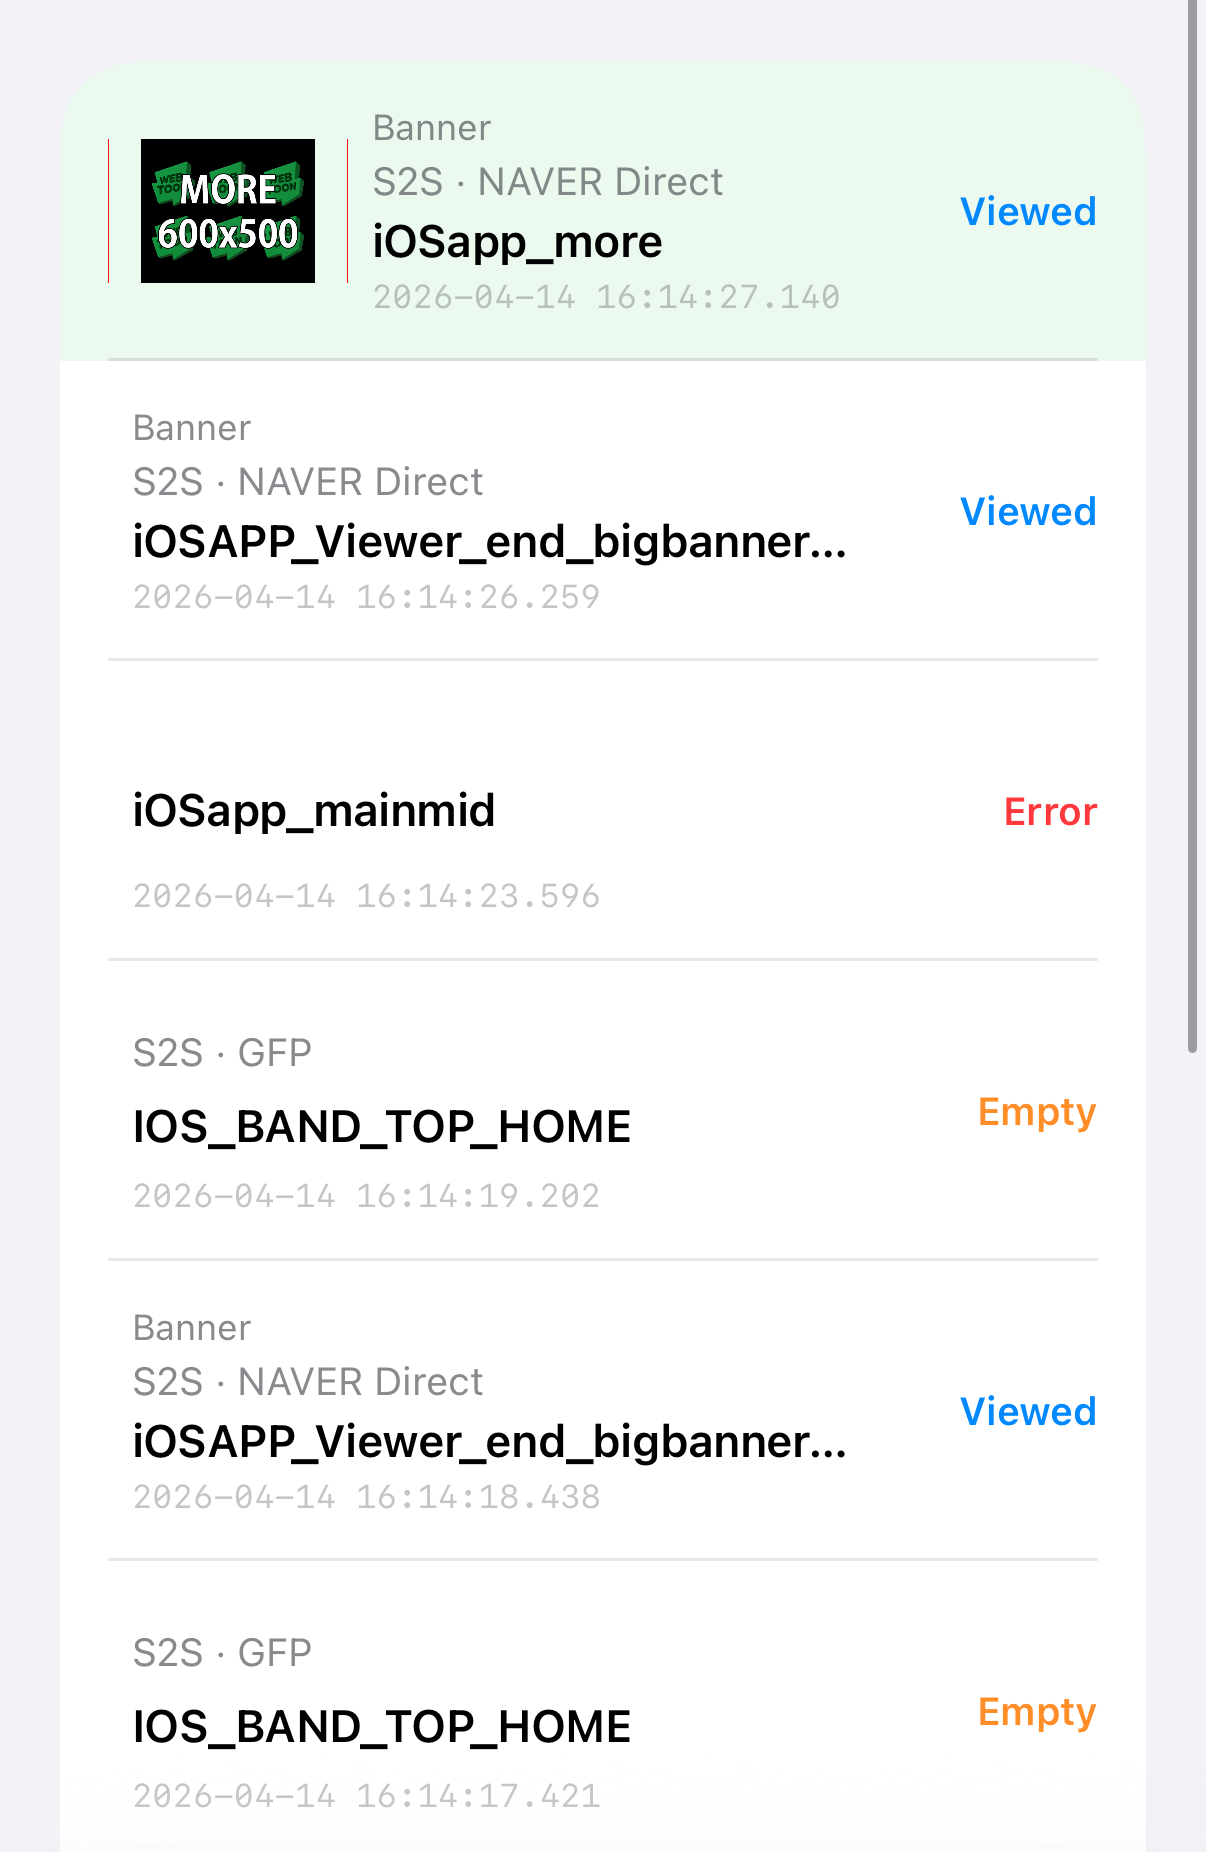
- The ad highlighted in green is the one that was used to open the Ad Debugger.
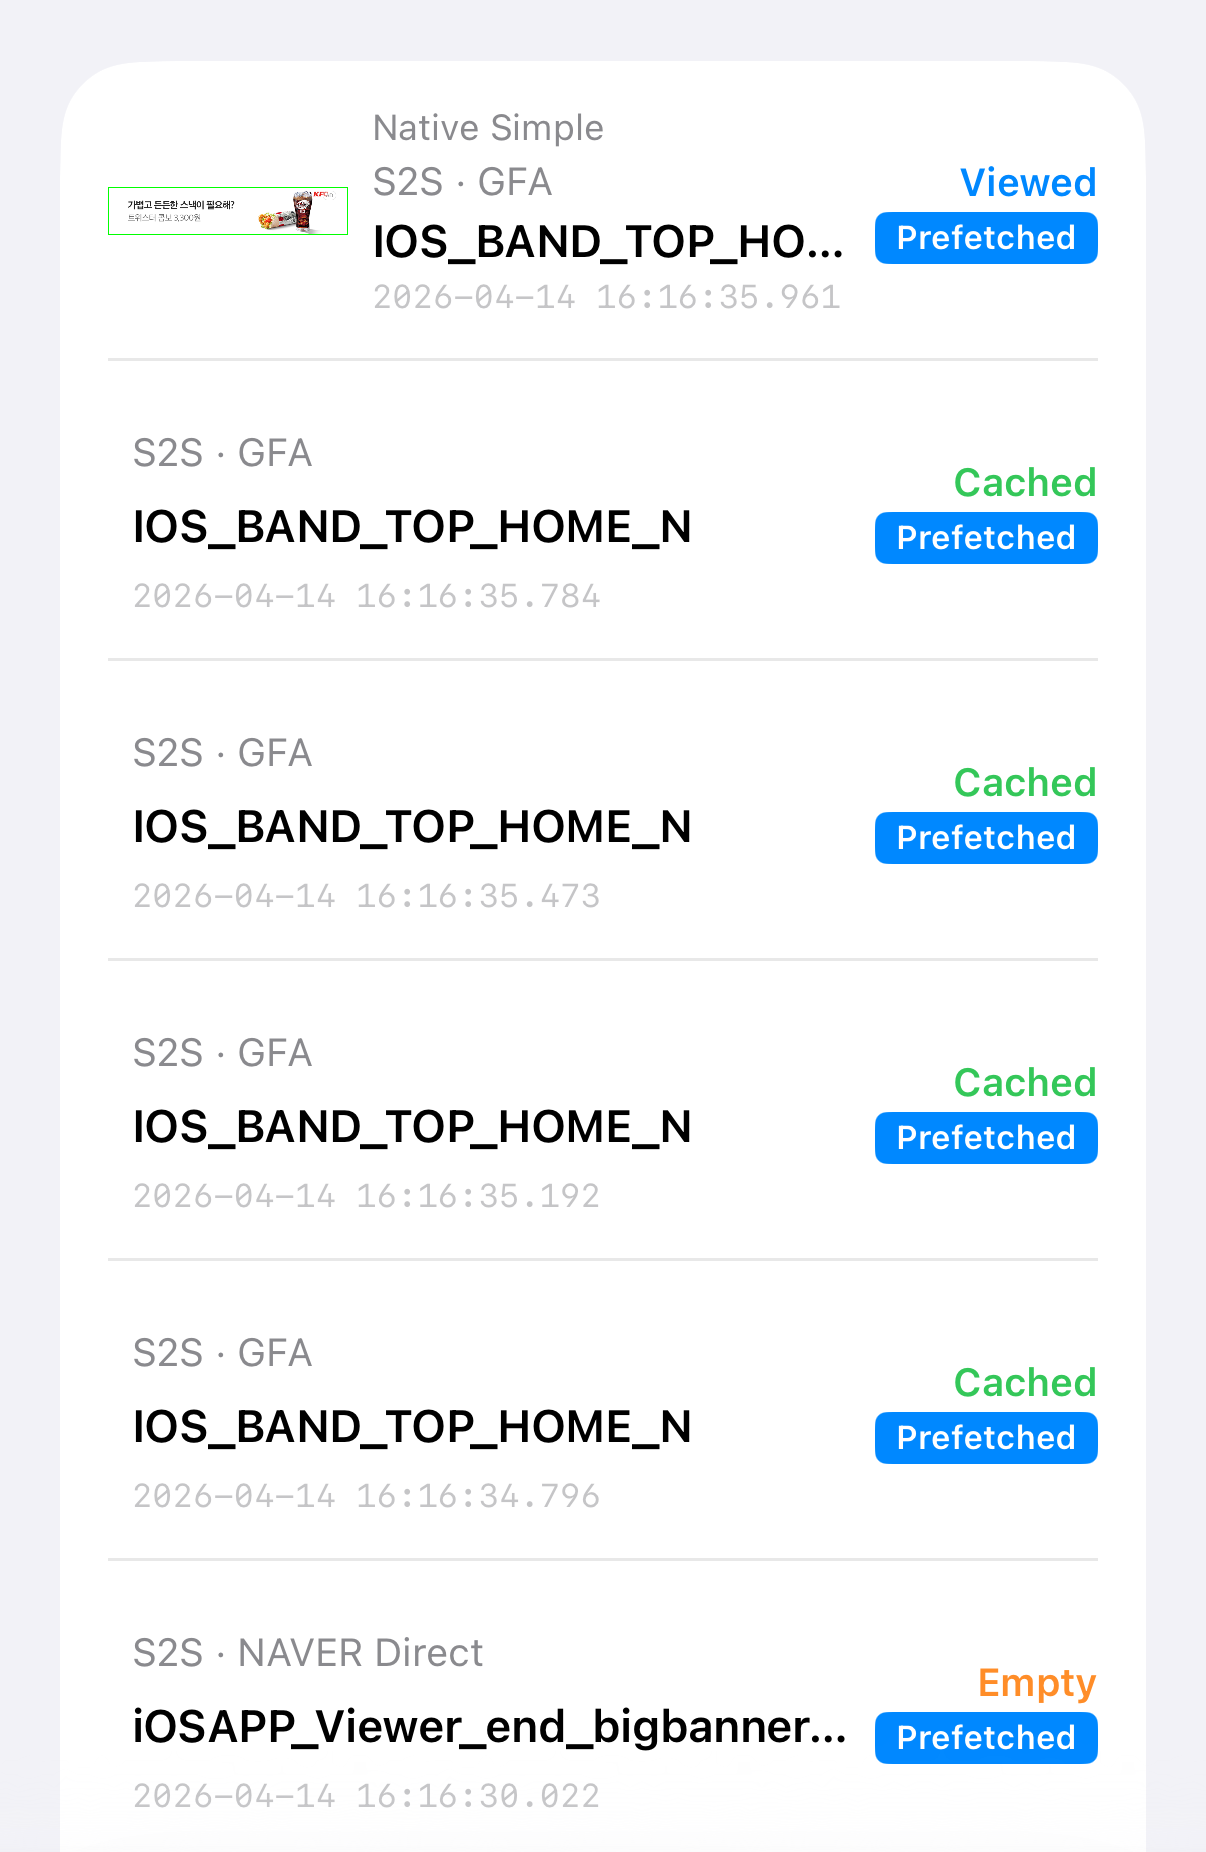
- Each ad log displays a status tag indicating its current state:
LoadingAd request is in progress.EmptyNo ad inventory available for this request (No-Fill).FilledAd was successfully received.CachedAd was loaded from the cache.ViewedAd was displayed to the user.ErrorAn error occurred during the ad request or rendering.
When ad caching is enabled, a Prefetched tag is displayed alongside the status.
Ad Details
Selecting an ad log opens a detail view with four tabs.
Overview Tab
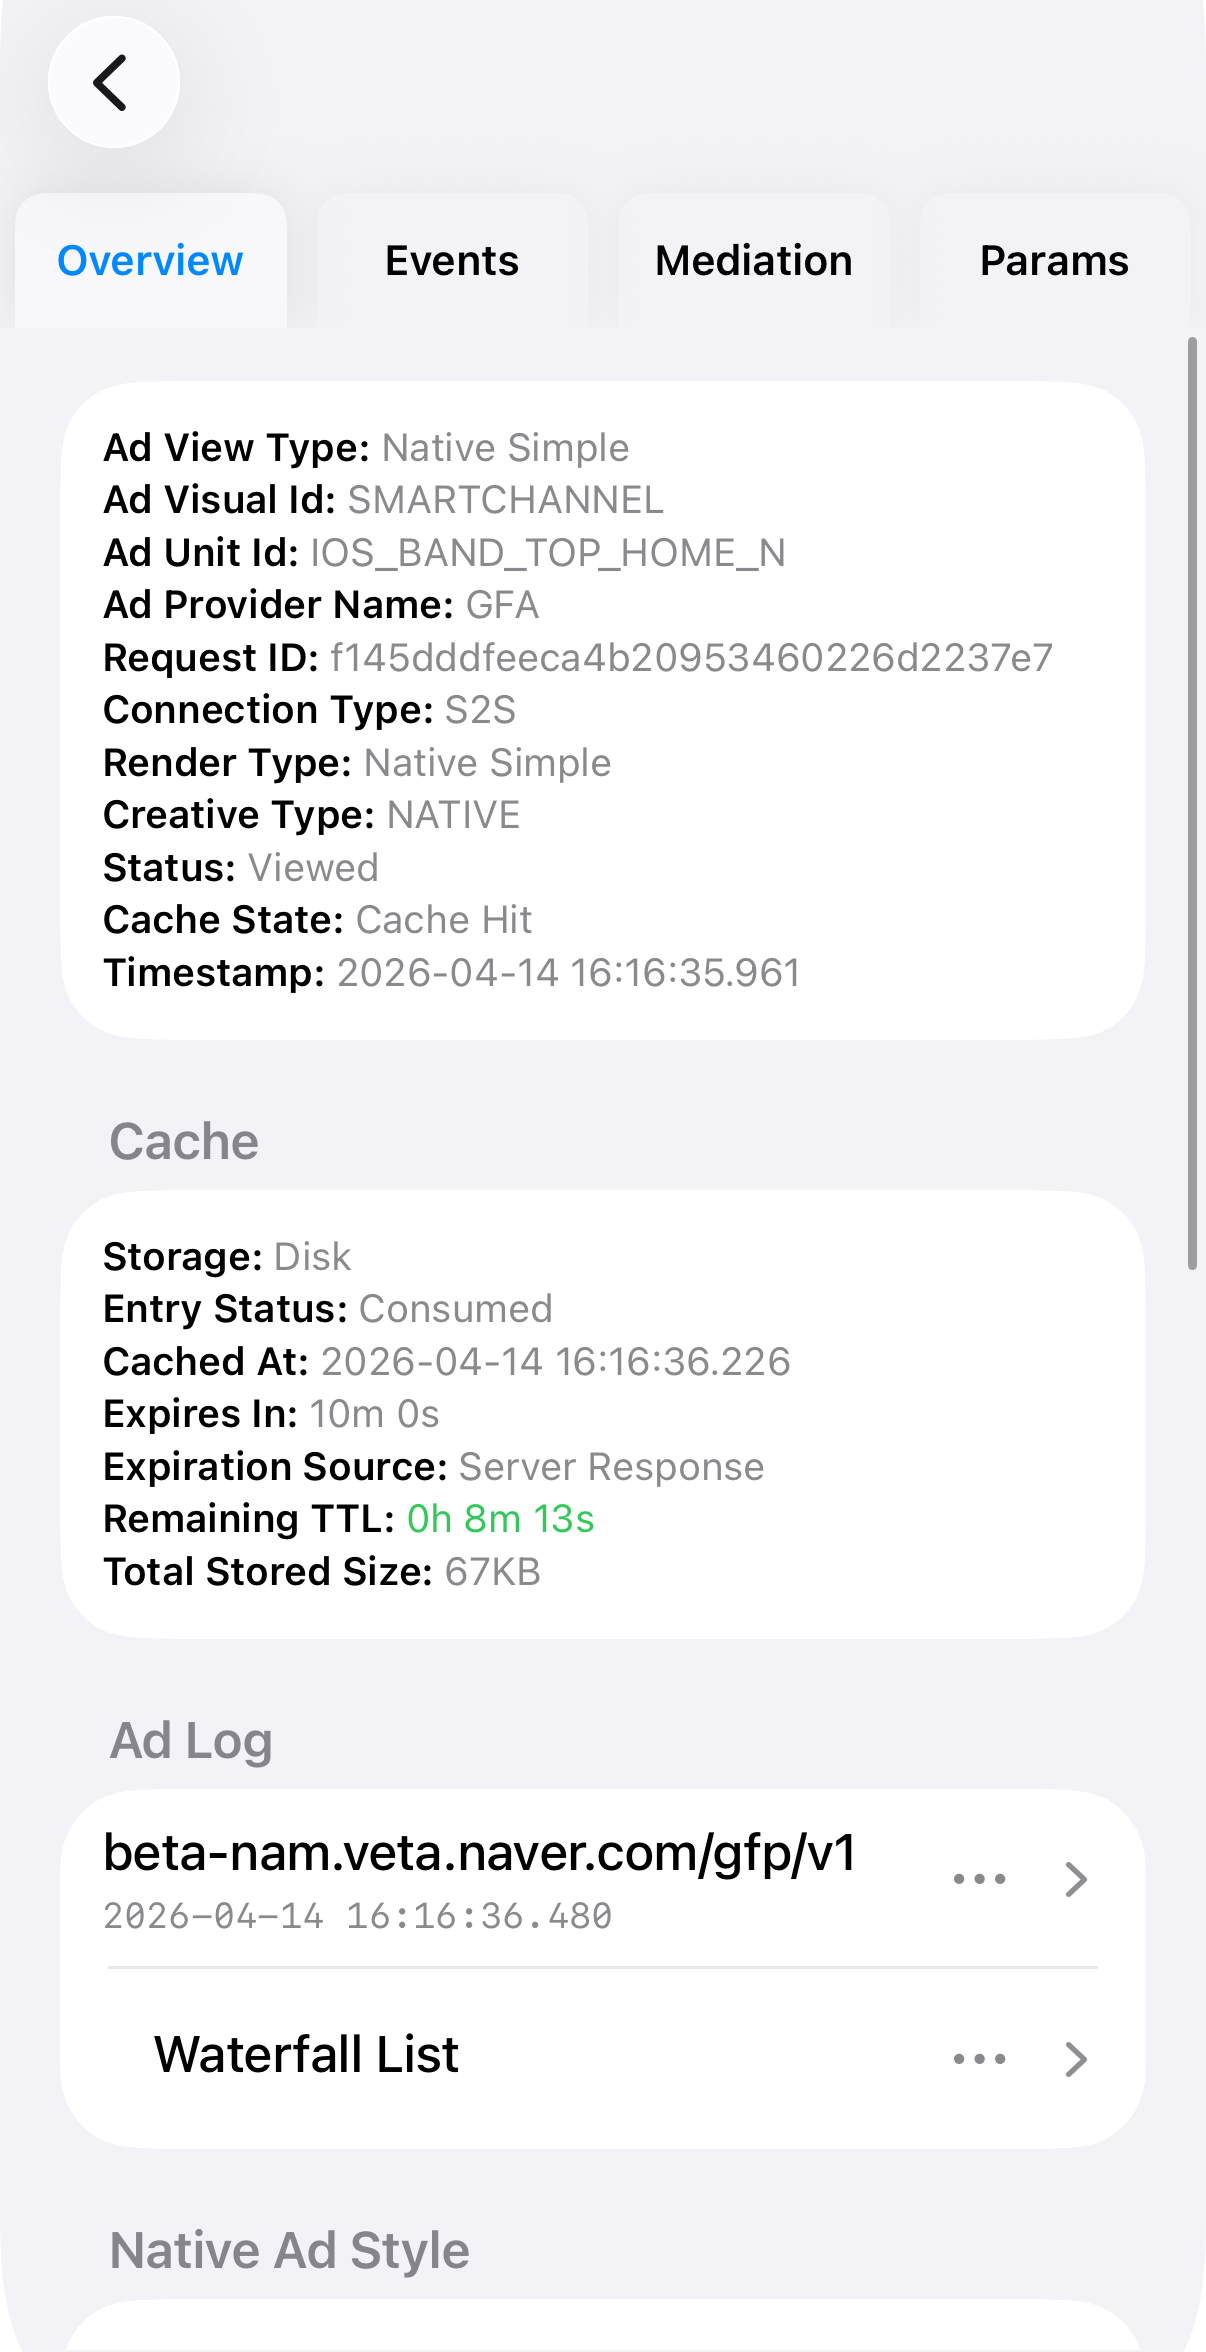
- Displays a summary of the ad's basic information.
- For cached ads, the Cache section shows storage location, entry status, expiration, TTL, and total stored size.
- Ad Log shows the raw API request and response for the ad call.
- Waterfall List shows the list of ad candidates returned in the response.
- Native Ad Style shows the style configuration returned for native ads.
- Native Ad Validator verifies the integration status of native ad view elements.
- Ad View Snapshot lets you explore the view hierarchy and rendering details for ads opened via gesture, or view a simple snapshot for other ads.
Events Tab
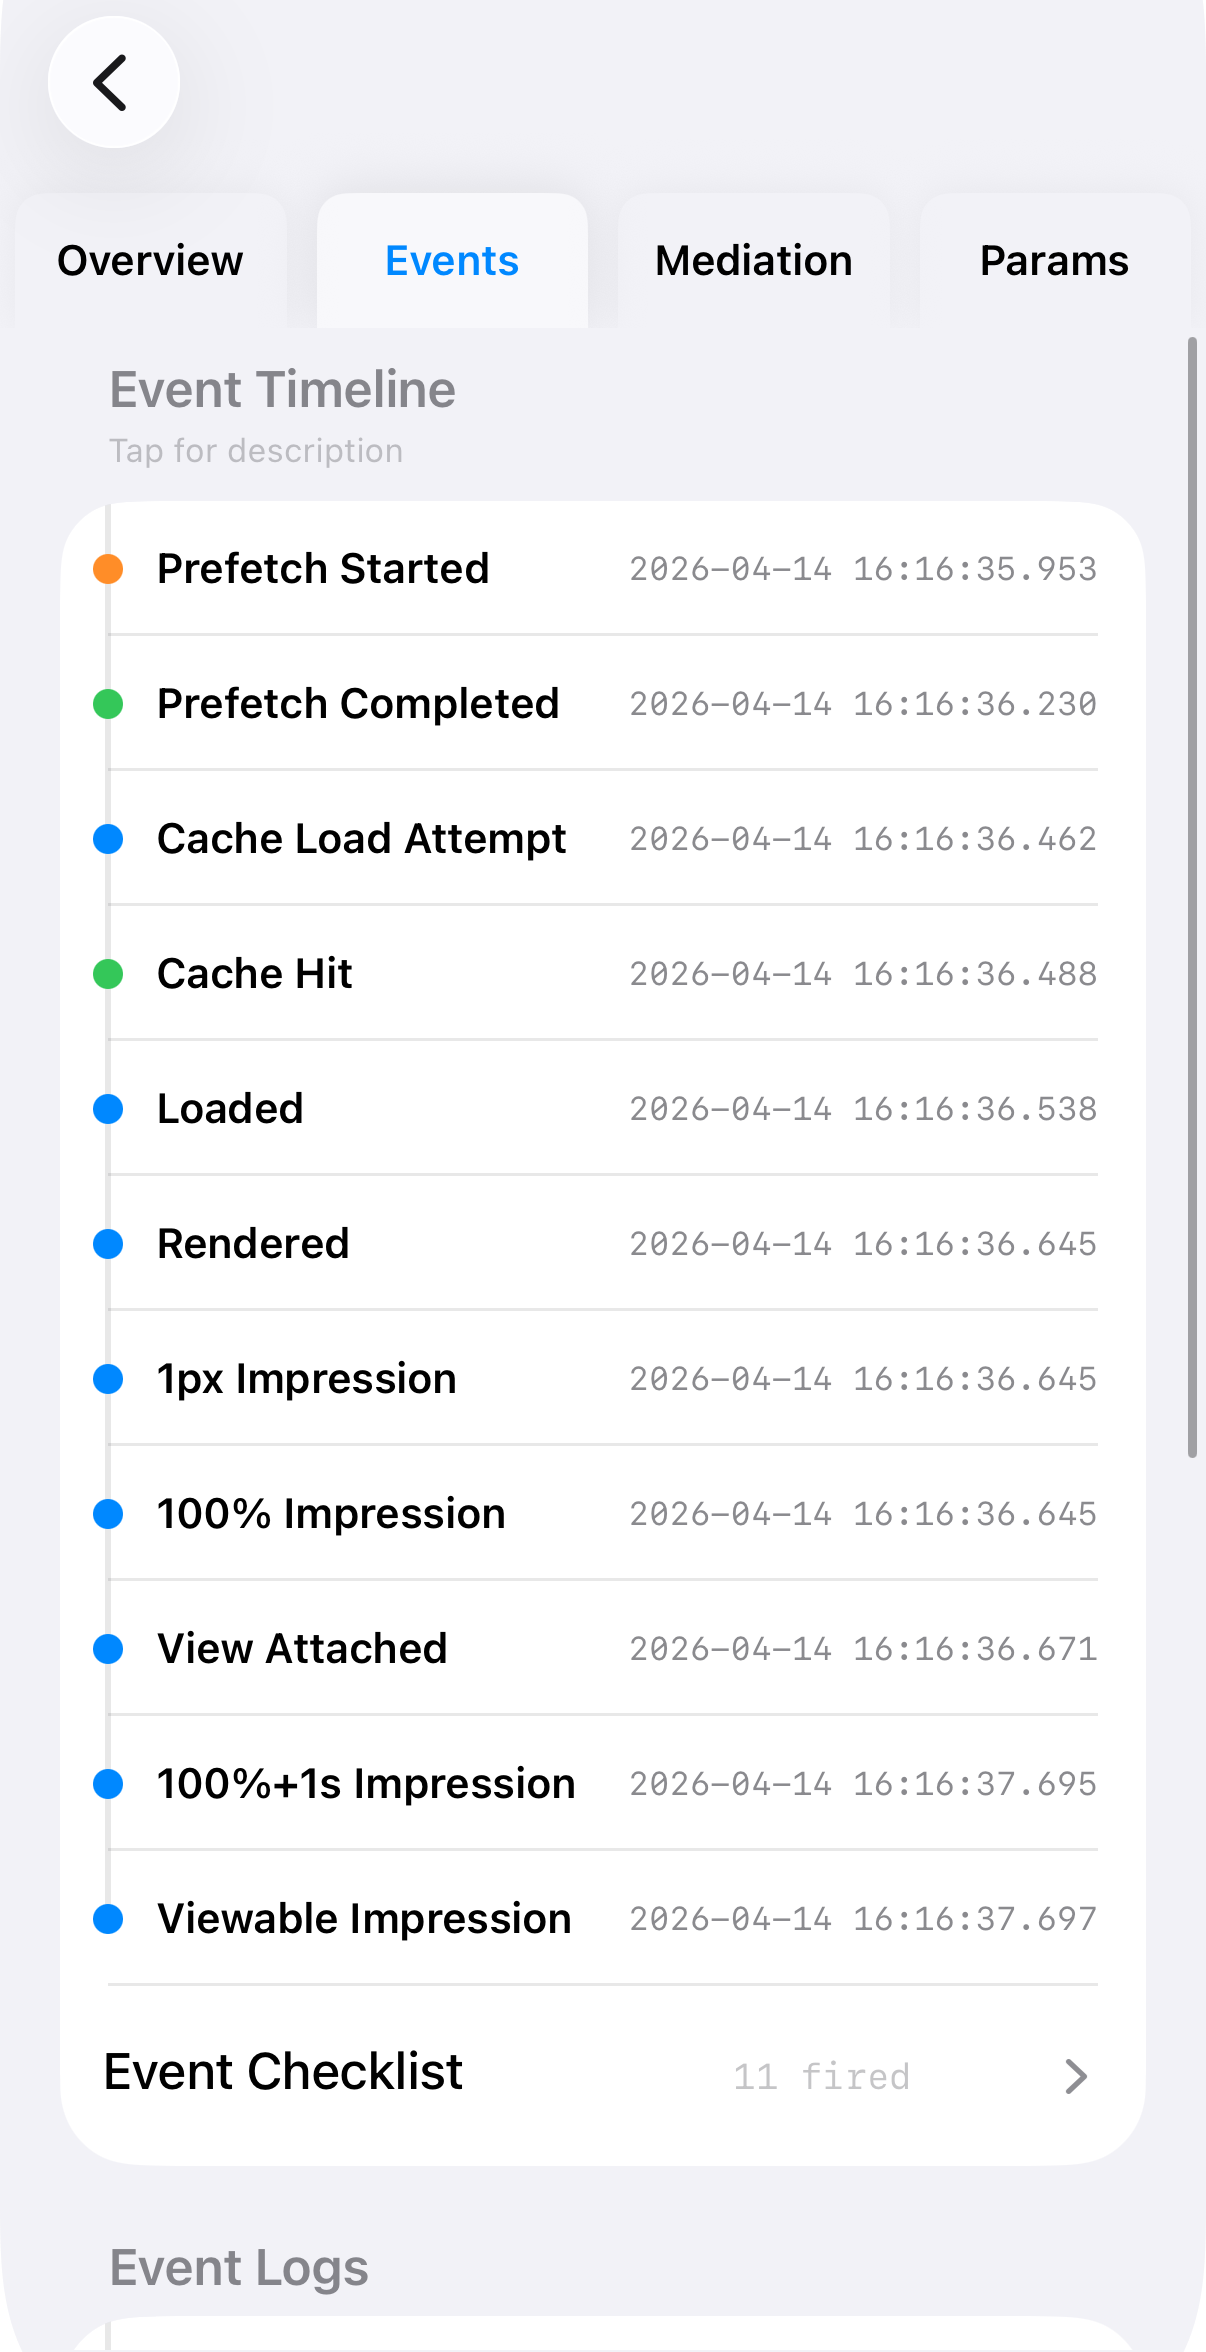
- Event Timeline shows the ad's lifecycle events in chronological order.
- Event Checklist provides a quick overview of which events have fired.
- Event Logs shows the request/response details for each event API call.
Mediation Tab
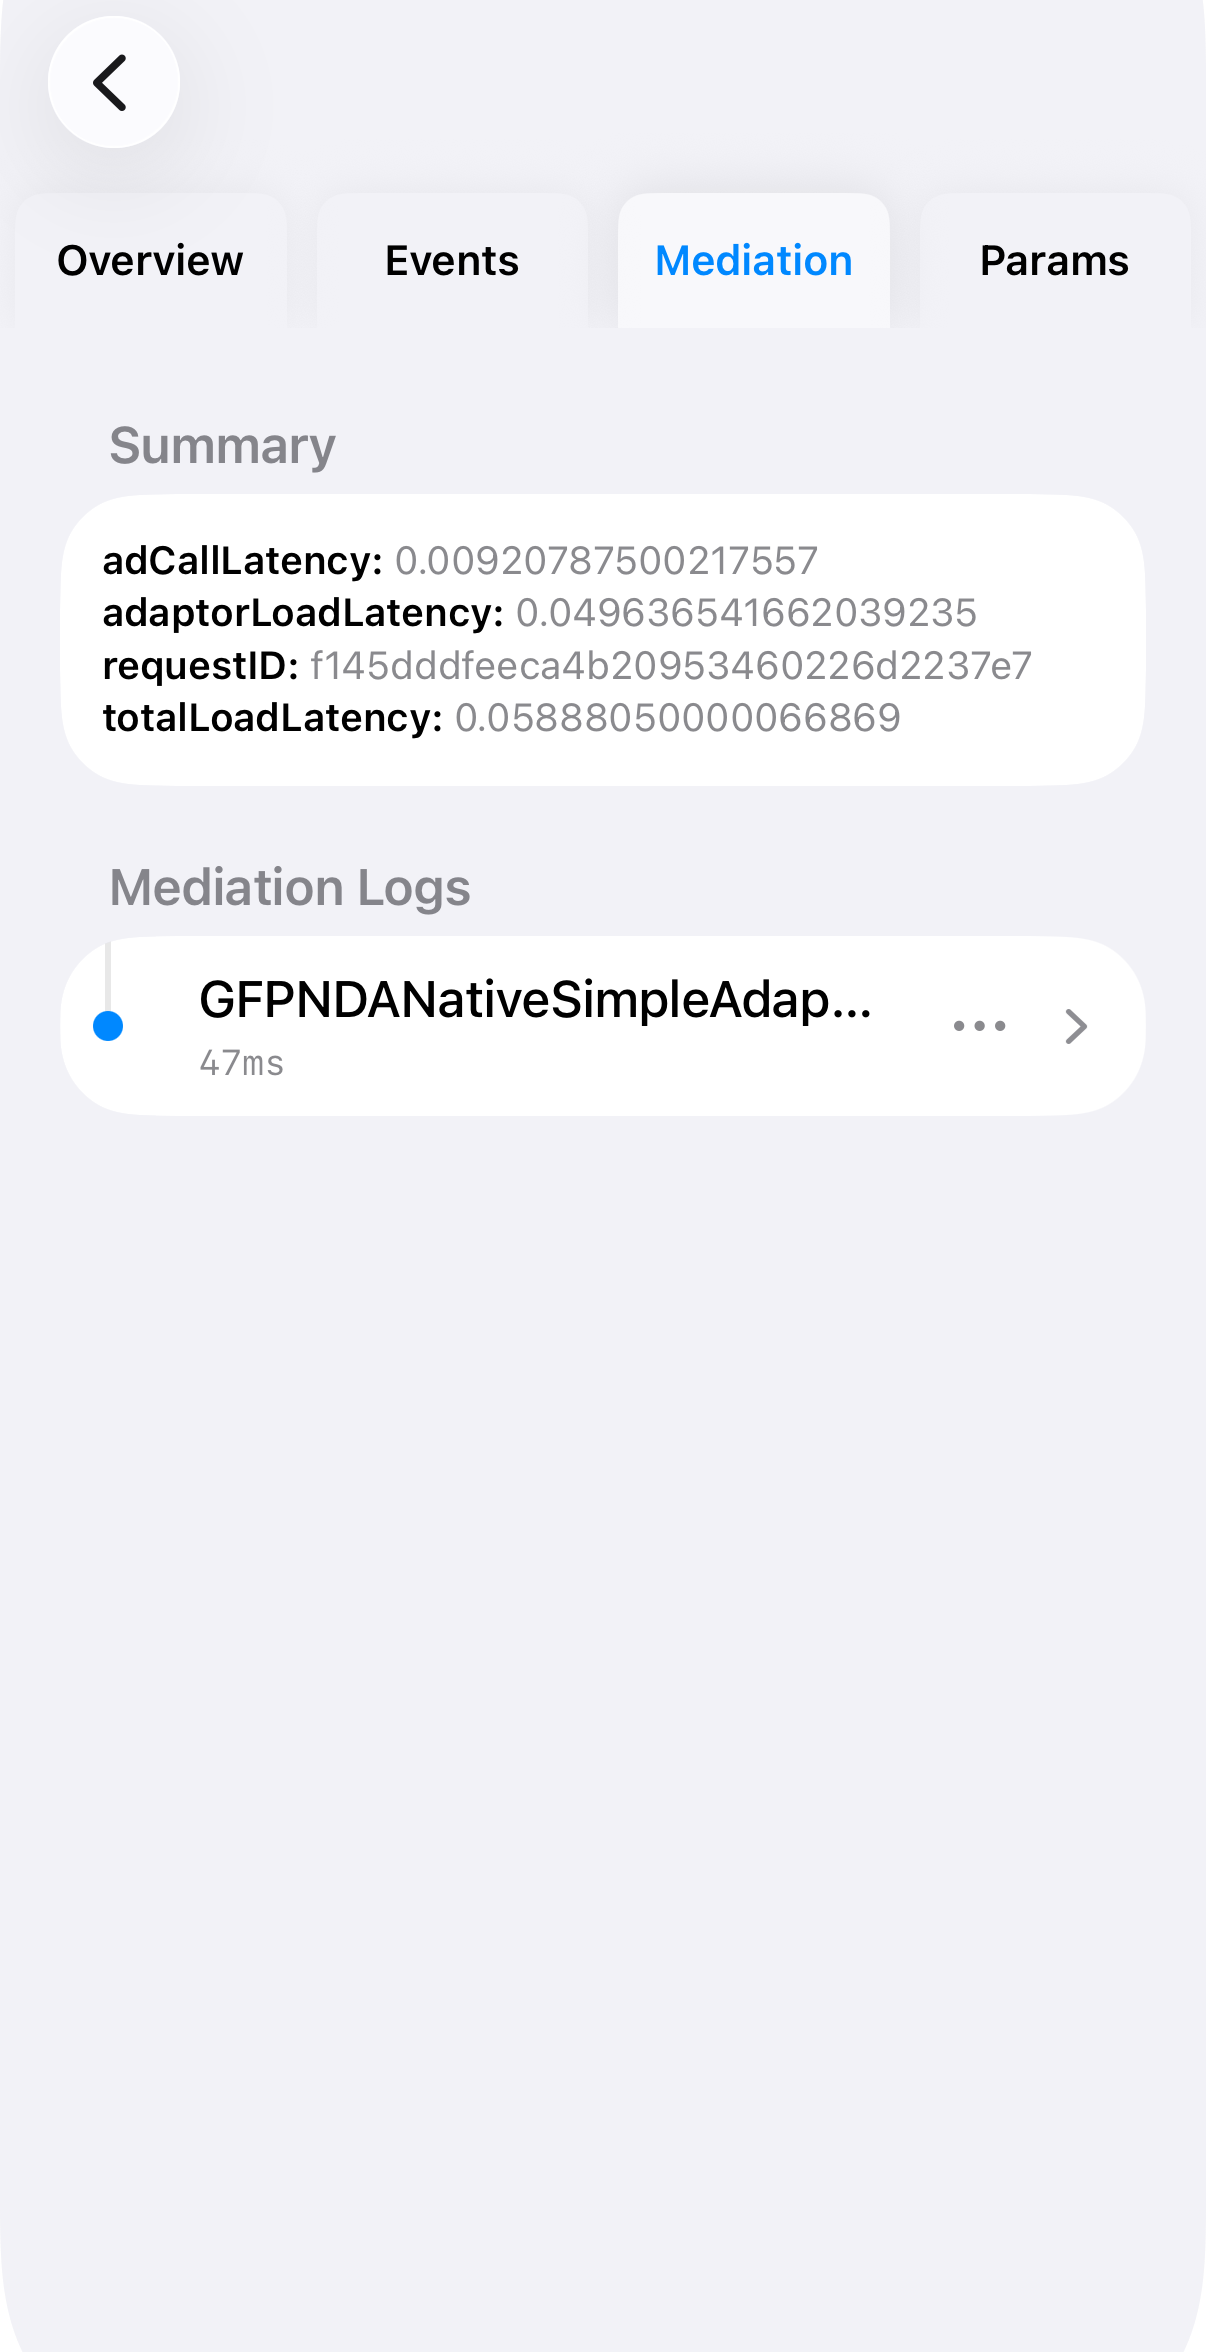
- Summary shows overall request latency metrics.
- Mediation Logs shows the ad selection process for each adapter.
Params Tab
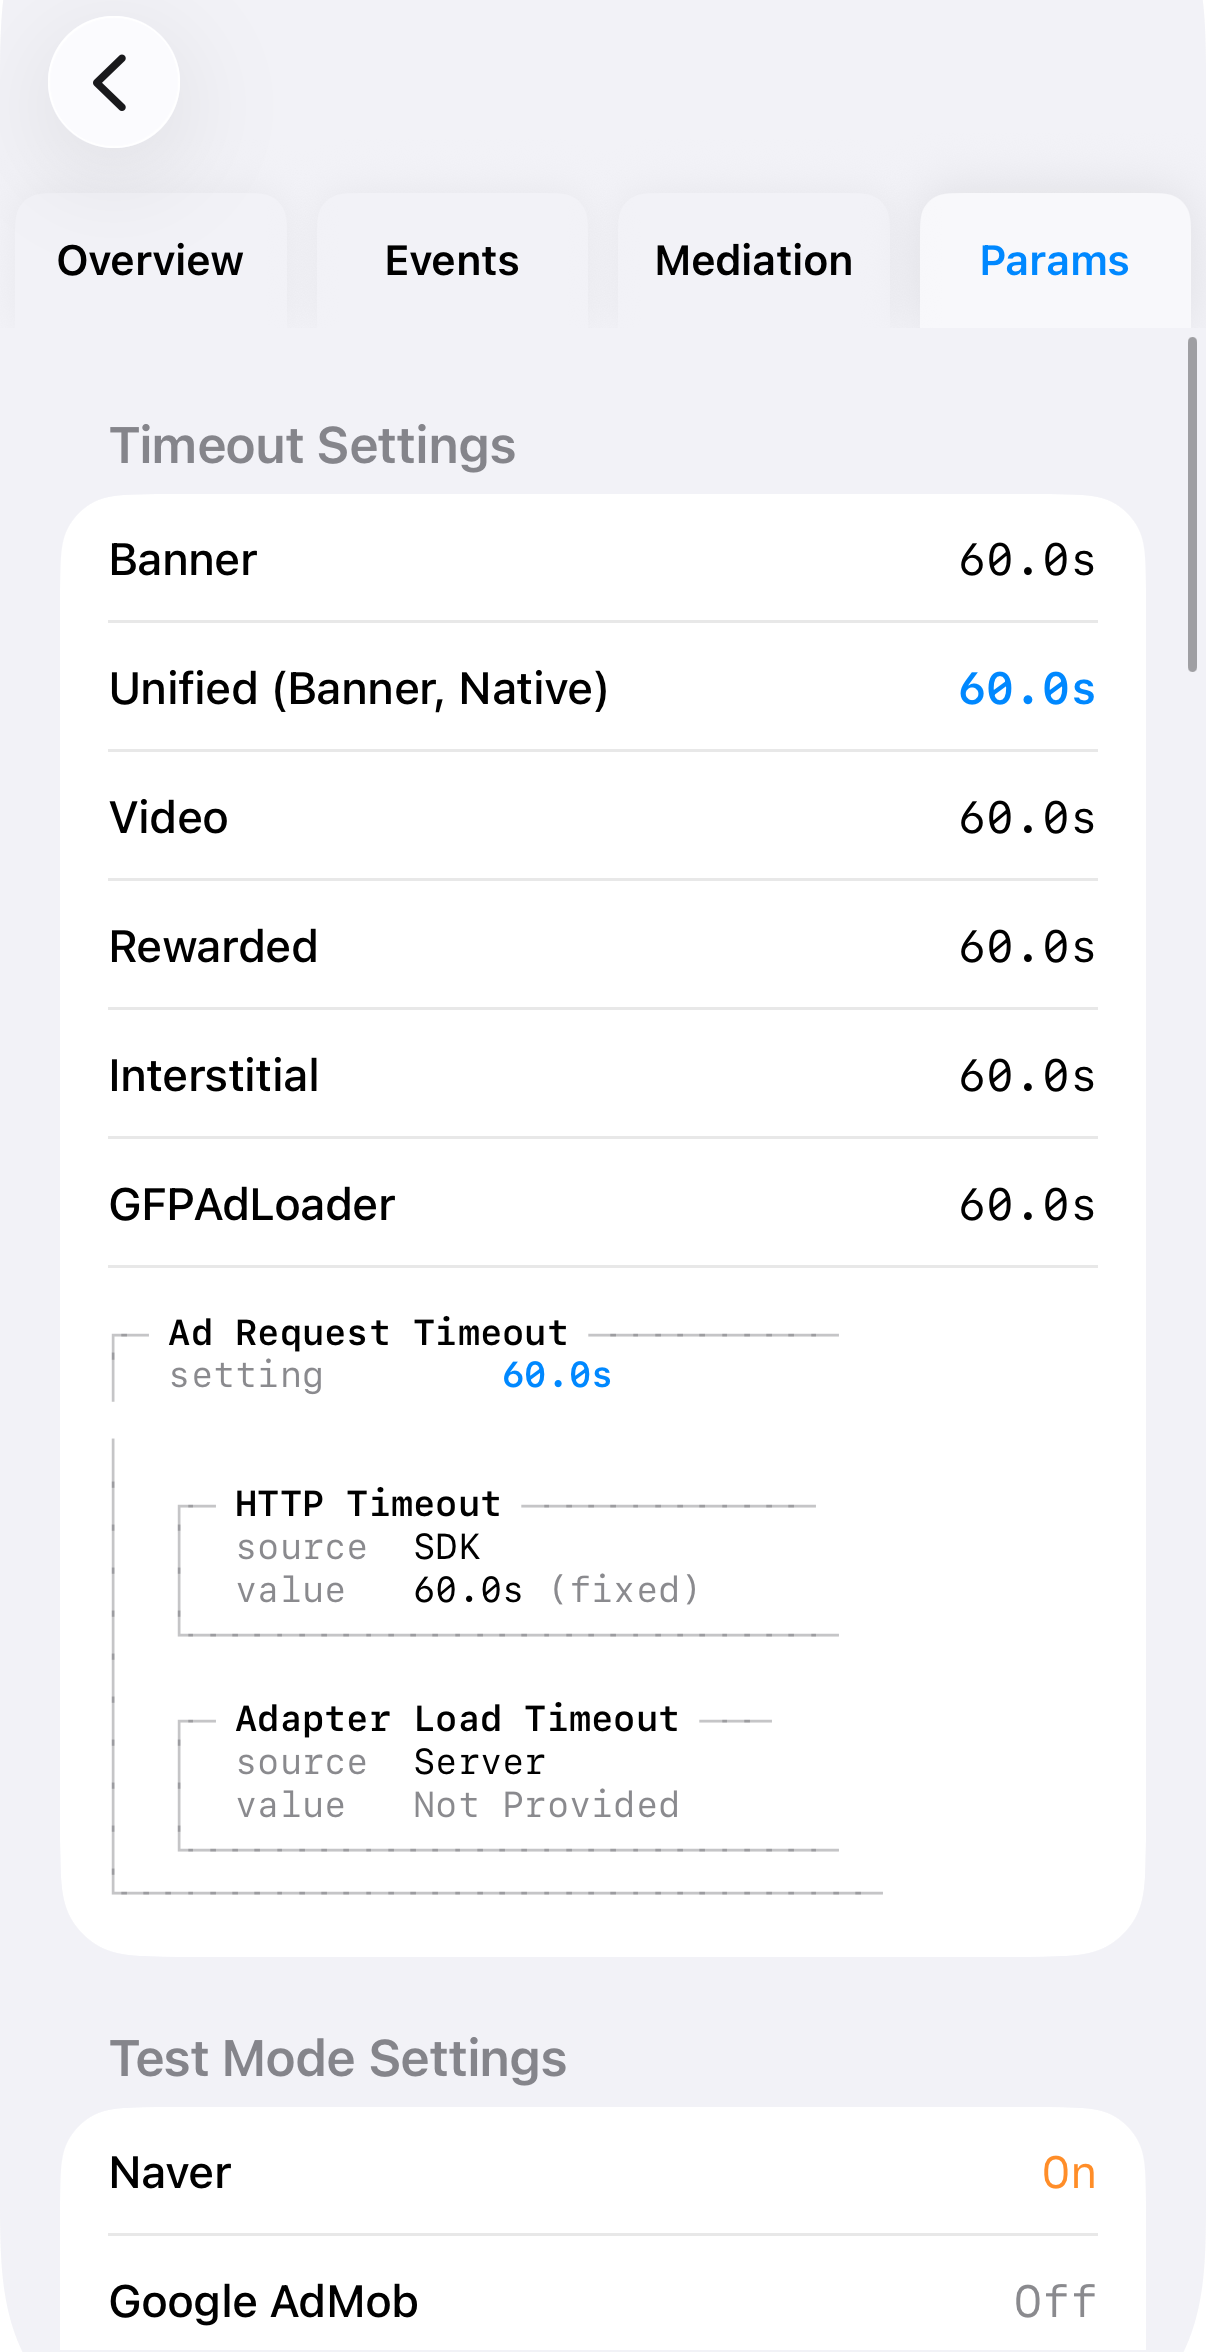
- Timeout Settings shows the timeout configuration for each ad format (Banner, Unified, Video, Rewarded, Interstitial). Blue-highlighted values and diagrams illustrate how timeout settings are being applied.
- Test Mode Settings shows whether test mode is enabled for each ad provider.
- Privacy Signals shows privacy-related configuration values.
Cached Ads
When ad caching is enabled, you can inspect the cache status for each ad unit.
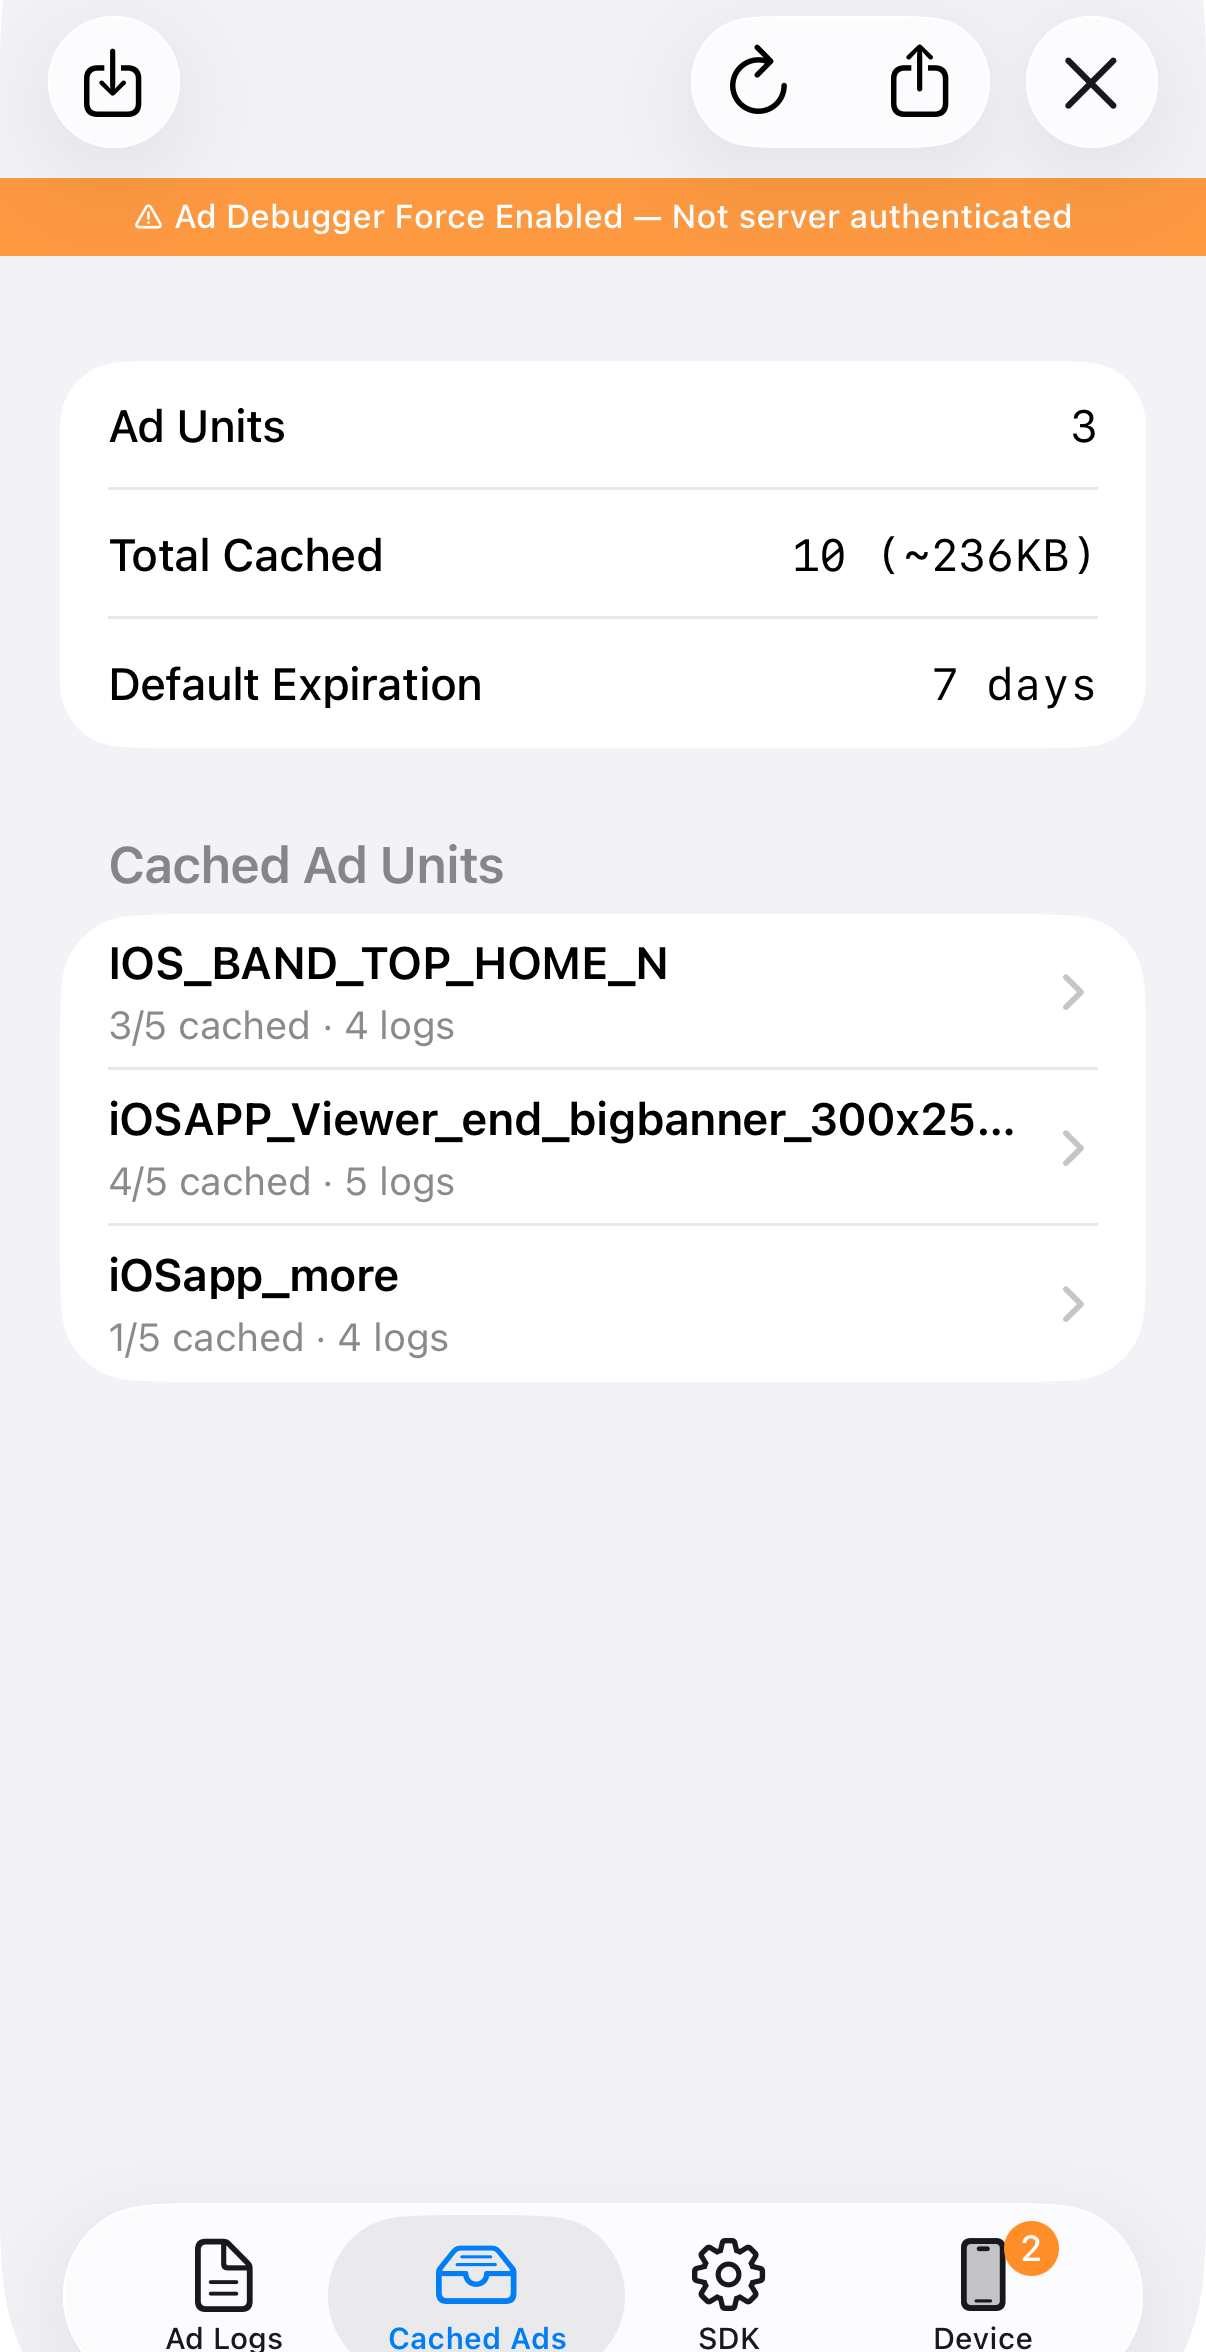
- Ad Units — Number of ad units with caching enabled.
- Total Cached — Total number of cached ads and their combined storage size.
- Default Expiration — The default cache expiration period, used when the ad response does not specify one.
Ad Unit Details
Select an ad unit to view its detailed cache log.
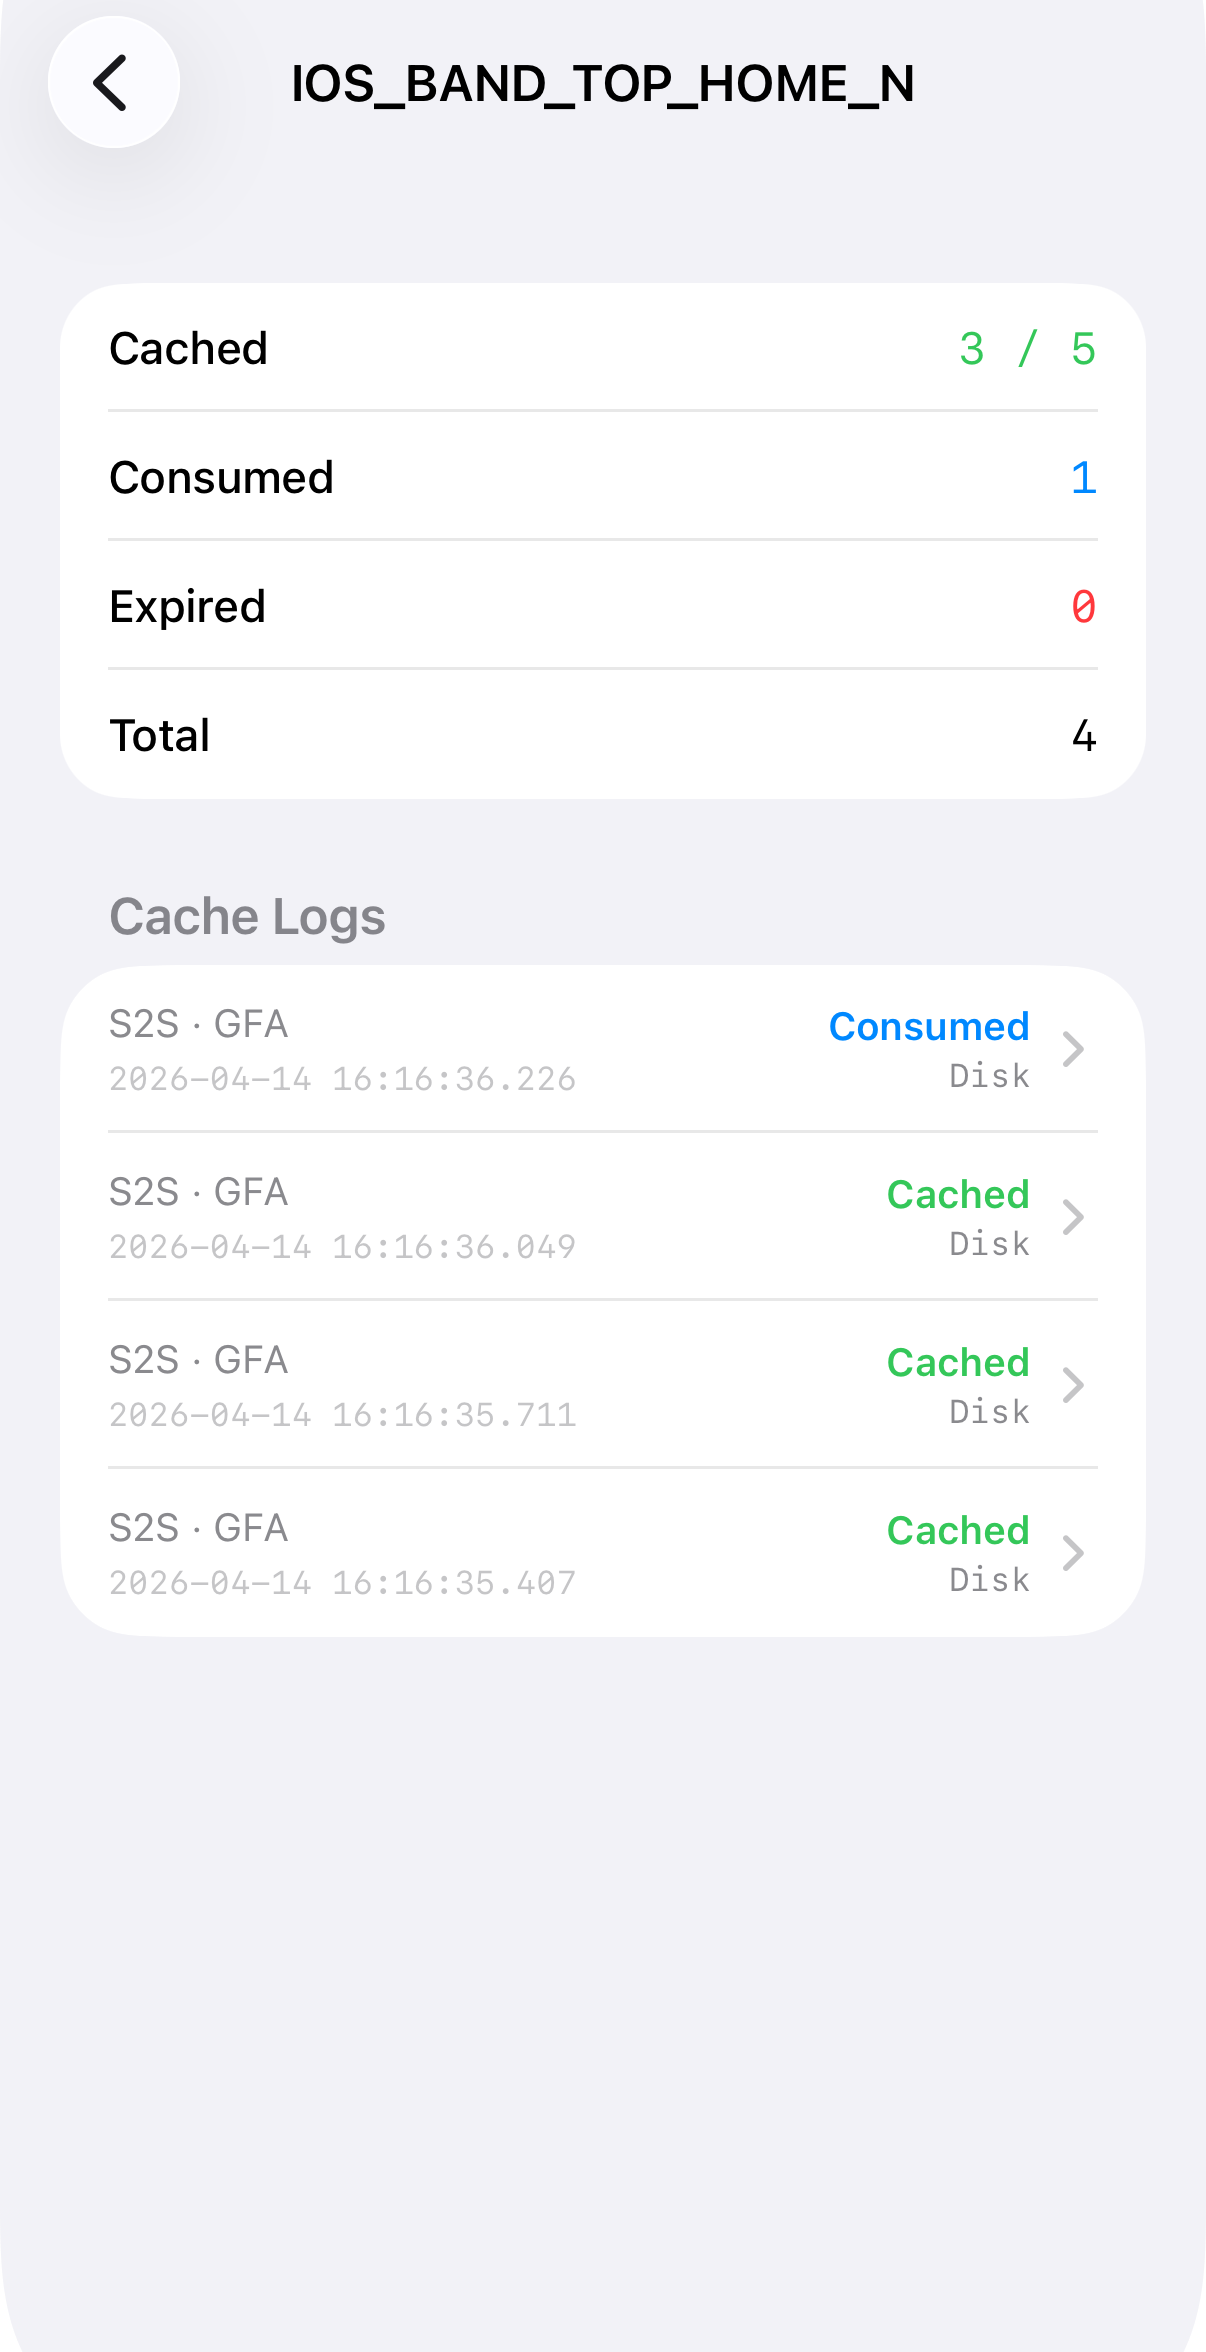
CachedCurrently stored in the cache.ConsumedRetrieved from the cache and used.ExpiredNo longer usable due to expiration.EvictedRemoved to free up cache space.
SDK Logs
The SDK logs screen is organized into three sub-tabs.
SDK Tab
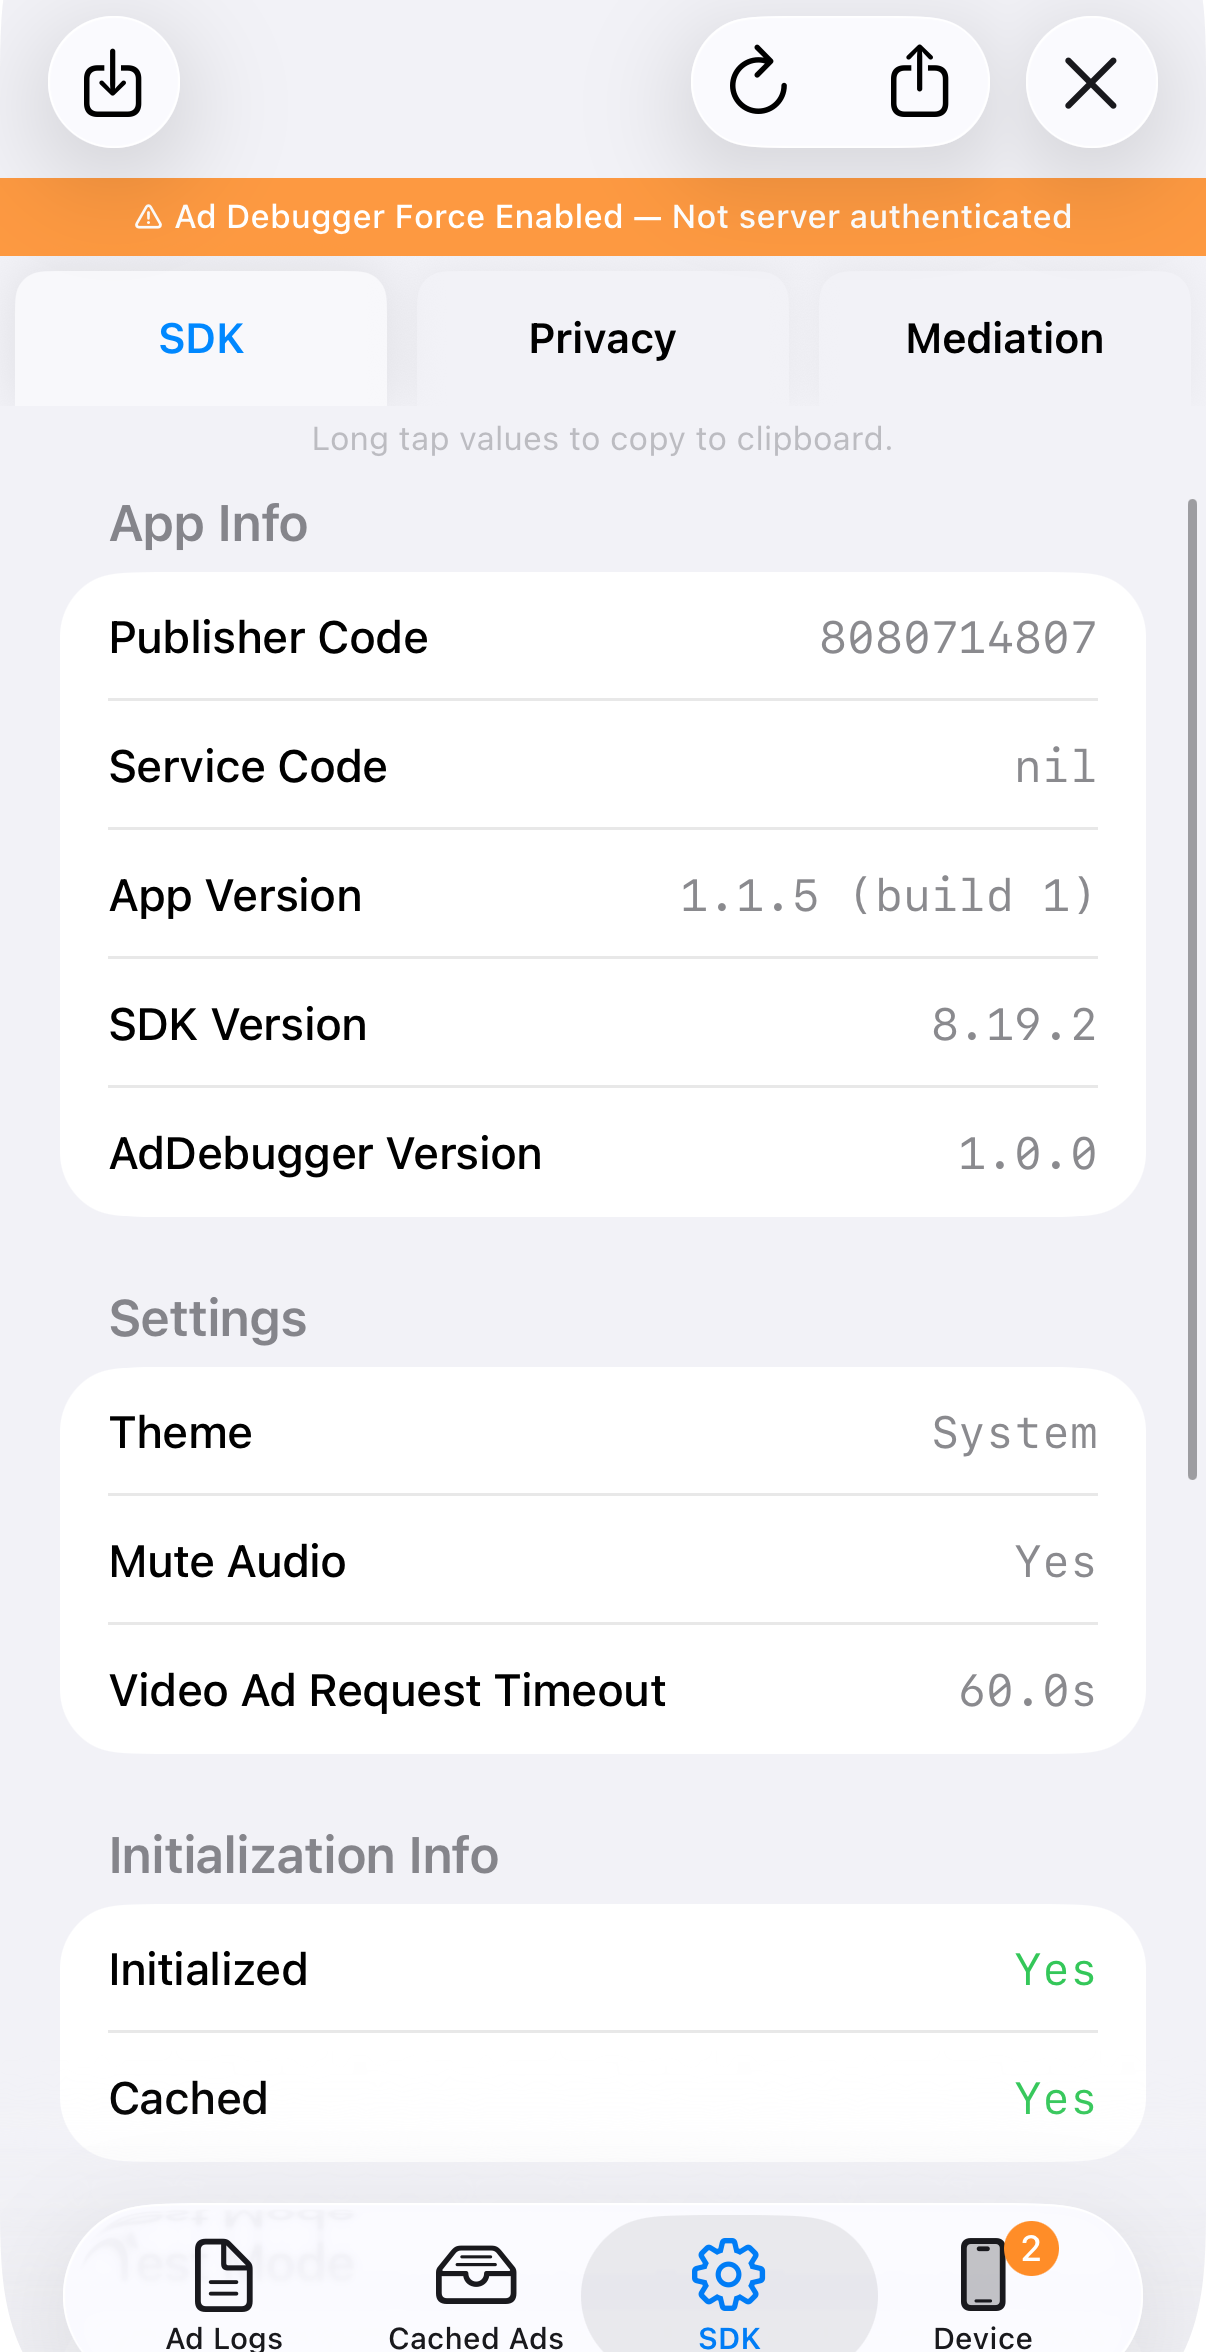
- App Info shows the Publisher Code, Service Code, App Version, SDK Version, and Ad Debugger Version.
- Settings shows current configuration such as theme, mute audio, and video ad request timeout.
- Initialization Info shows whether the SDK initialized successfully and whether the init response was cached.
Privacy Tab
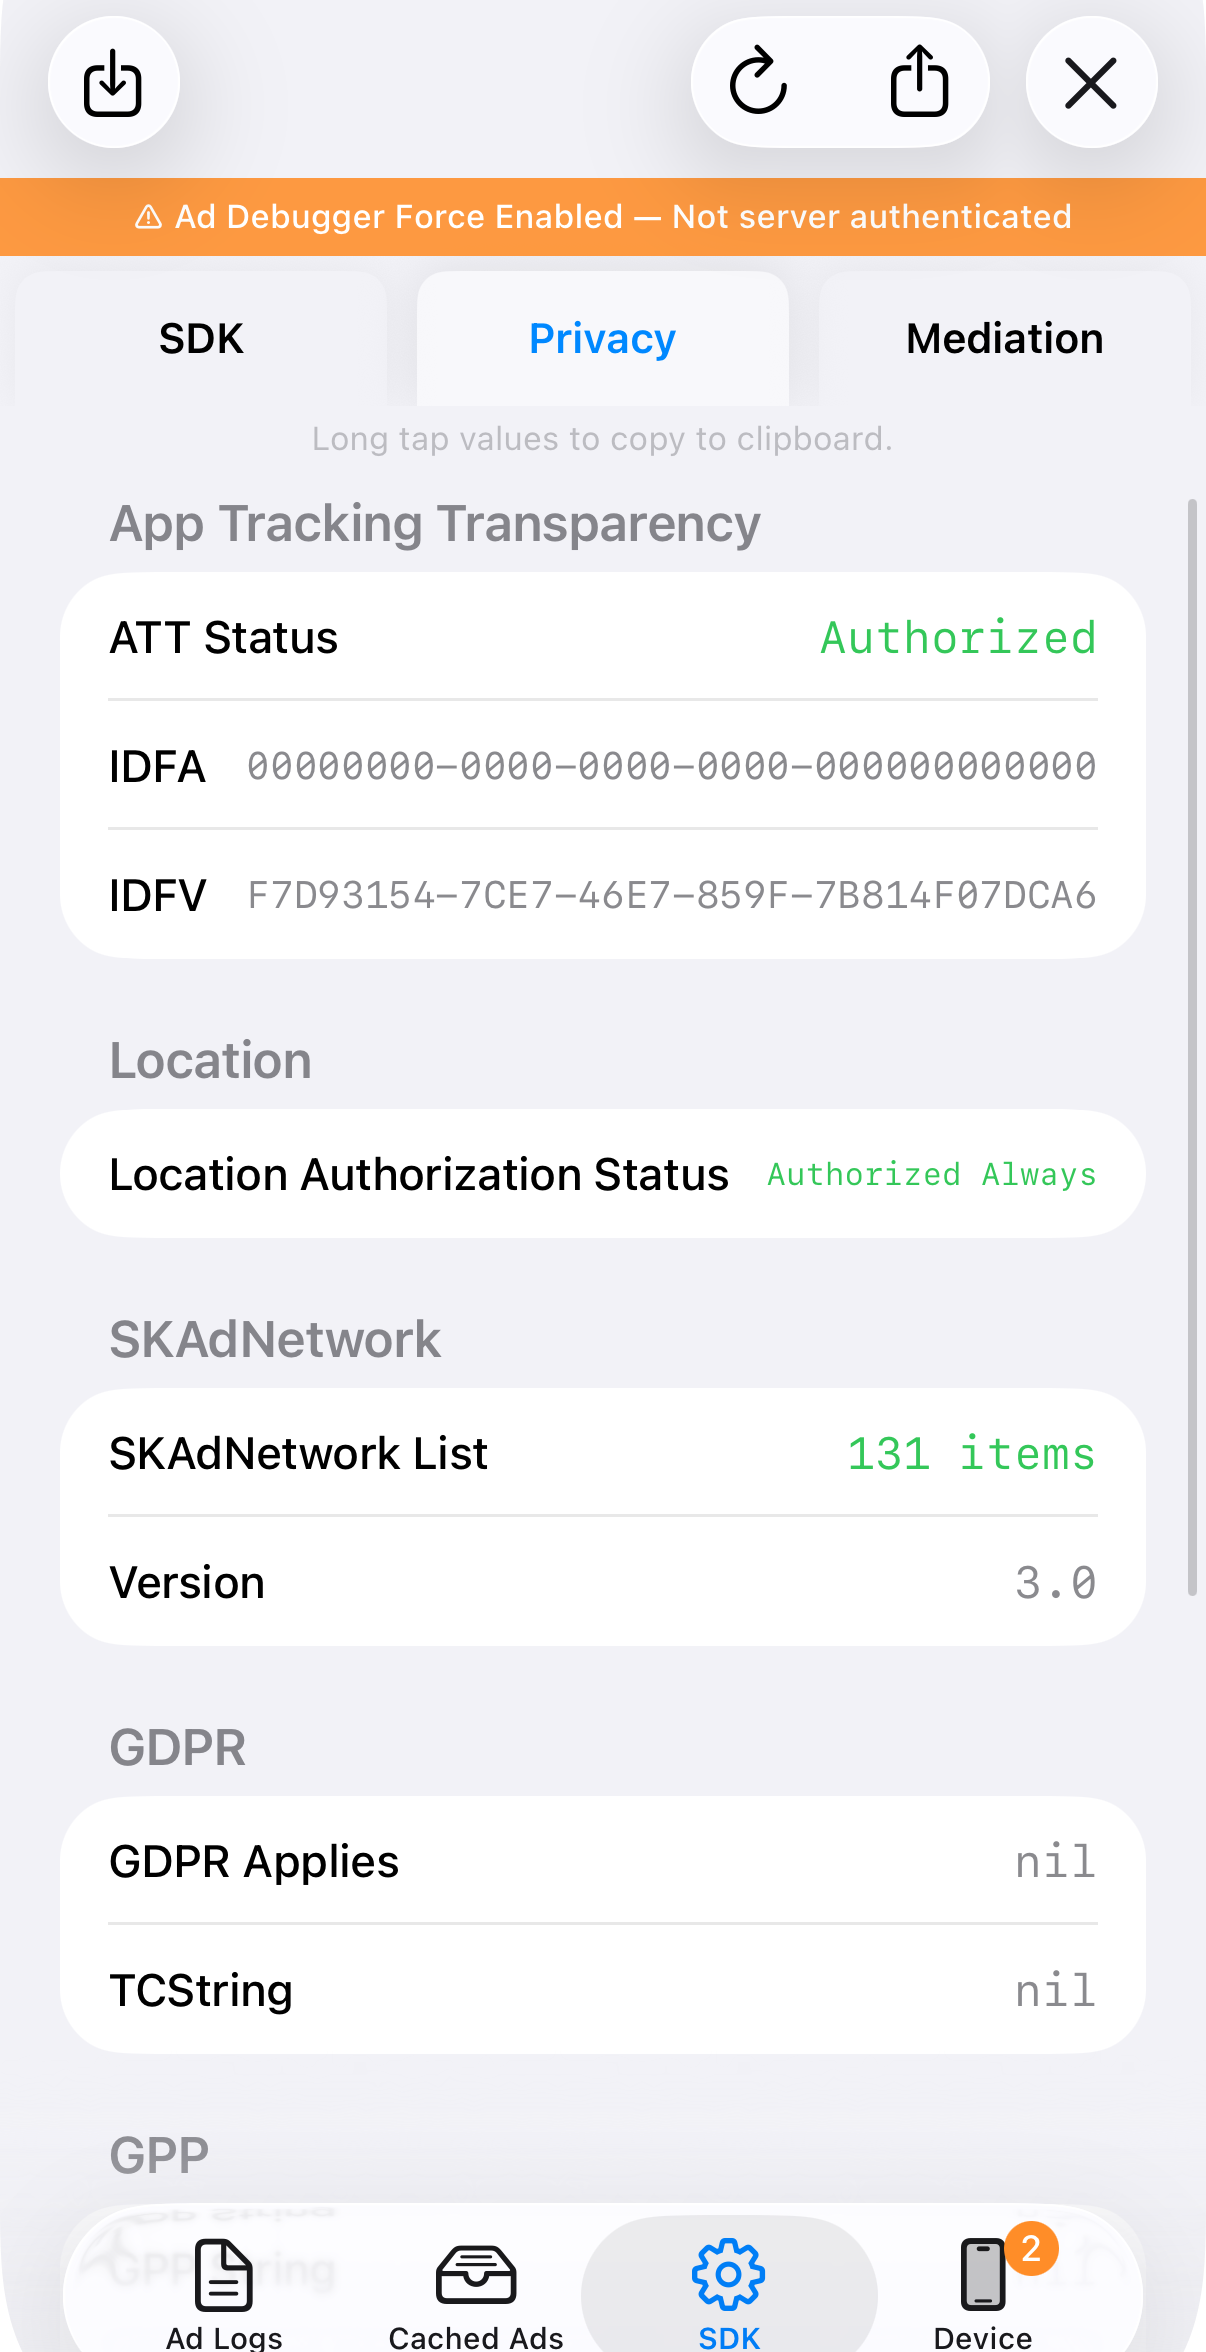
- App Tracking Transparency shows the ATT authorization status, IDFA, and IDFV.
- Location shows the current location permission status.
- SKAdNetwork shows the registered SKAdNetwork list and version.
- GDPR / GPP shows privacy regulation settings.
Mediation Tab
- Shows information about mediation network adapters used to render ads from external DSP SDKs.
- Check Pod installation status for each external DSP:
InitializedPod is installed and was pre-initialized during SDK setup, enabling faster initial ad rendering.InstalledPod is installed and ready to render ads from this DSP when received.Not InstalledPod is not installed.Not InitializedPod is installed but failed to initialize.BlockedAd delivery is disabled for this Pod version due to a server-side block.
Device Info

Provides a comprehensive view of the device's hardware, network, and app environment. The following items are particularly useful when diagnosing ad issues:
- iPad Window Mode — Shows the current multitasking state (Split View, Slide Over, etc.), which is helpful for diagnosing layout-related issues on iPad.
- Network — Shows the current network connection type and status.
- Proxy — Detects proxy configurations and flags cases that may interfere with ad requests.
- Ad Blocker Detection — Alerts you when an ad blocker is detected, helping quickly identify why ads may not be appearing.