Ad Debugger
Starting from NAM SDK 8.14.0, Ad Debugger is officially supported.
Ad Debugger is a debugging tool that allows you to check ad requests, responses, mediation, and device information in real time.
It is useful for diagnosing issues during ad integration or checking ad loading status.
Enabling
There are two ways to enable Ad Debugger.
1. Enable from Code
- Kotlin
- Java
GfpAdDebugger.setEnabled(true)
GfpAdDebugger.setEnabled(true);
A warning dialog is displayed when Ad Debugger is enabled in release builds. It is recommended not to enable Ad Debugger in production environments.
2. Server-based Enabling
By registering the Advertising Identifier (ADID) of a test device through a GFP/NAM administrator, Ad Debugger will be automatically enabled when the SDK is initialized on that device. This is useful for debugging in QA environments or release builds without any code changes.
Server-based enabling only works for registered ADIDs and is automatically deactivated after a certain period. The enabled state is cached on the device so it does not request the server every time.
Opening
There are two ways to open Ad Debugger.
1. Open with Gesture
Press and hold with three fingers for 2 seconds on an ad view to open Ad Debugger. The log for the corresponding ad is automatically selected and displayed.
2. Open from Code
Call GfpAdDebugger.show() to open it programmatically.
- Kotlin
- Java
// Open the debugger (shows the latest ad log)
GfpAdDebugger.show(context, null)
// Open the debugger (shows the latest ad log)
GfpAdDebugger.show(context, null);
Screen Layout
Ad Debugger consists of 4 tabs: Ad Logs, SDK, Device, and Cached Ads.
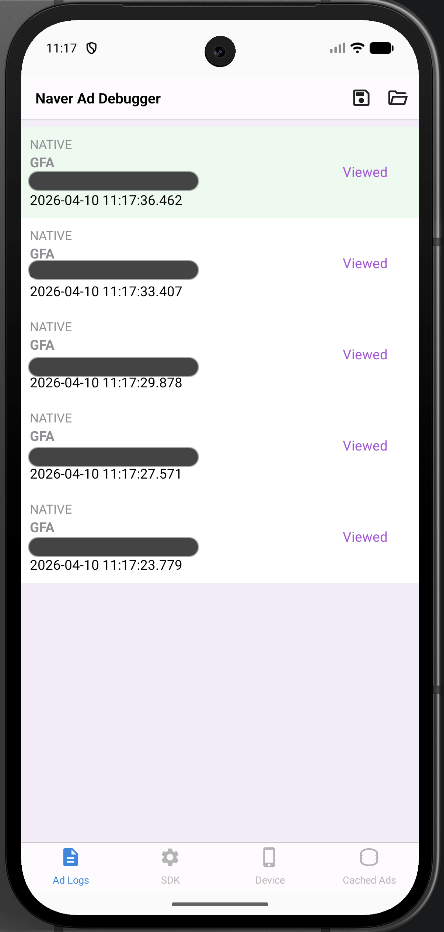
Ad Logs Tab
Displays a list of logs for requested ads. Each item shows the ad unit ID, ad status, request time, and more.
Ad statuses are displayed as follows:
| Status | Description |
|---|---|
| Viewed | Ad was successfully displayed |
| Filled | Ad was loaded but not yet displayed |
| Cached | Ad was cached to disk |
| Empty | No ad response (No-Fill) |
| Error | Error occurred during ad loading |
Ad Log Details
Select an item from the list to view detailed information about the ad. The detail screen consists of the following tabs.
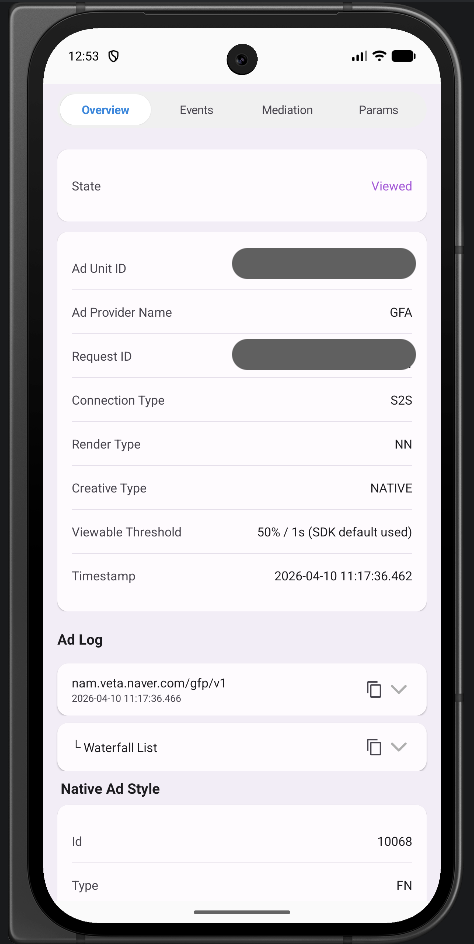
Overview
Shows overall summary information for the ad load.
-
State: Current state of the ad
-
Summary: Key information about the ad request and response
Item Description Ad Unit ID Ad unit identifier Ad Provider Network name that served the ad Request ID Unique identifier for the ad request Connection Type Network connection type Render Type Ad rendering method Creative Type Ad creative type Viewable Threshold Viewability threshold (e.g., 50% / 1s) -
Latency: Visualizes the time taken from request to response to load
-
Errors: List of errors that occurred (error code, message, timestamp)
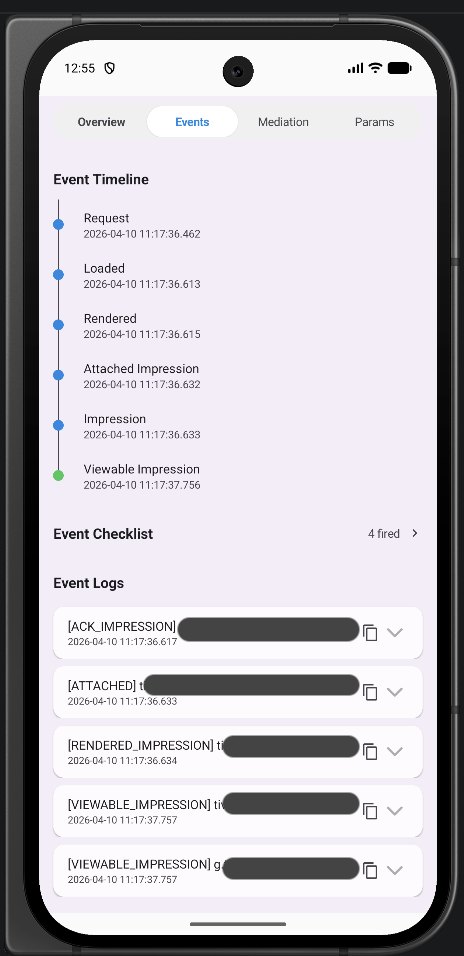
Events
Shows events during the ad loading process in chronological order.
-
Event Timeline: Timeline of each stage such as ad request, response received, adapter load, impression, etc.
-
Event Checklist: Checks whether key events occurred by category
Category Key Events Ad Lifecycle Loaded, View Attached, Rendered, Viewable Impression Viewability 1px Impression, 100% Impression, 100%+1s Impression User Actions Clicked, Ad Opt-Out, Privacy Info, Bounce Back Rewarded / Interstitial Reward Complete, Closed Cache Events Cache Hit, Cache Miss, Prefetch Success/Failed Errors Load Error, Start Error, Lazy Render Failed
Mediation
Shows information about ad networks that participated in mediation.
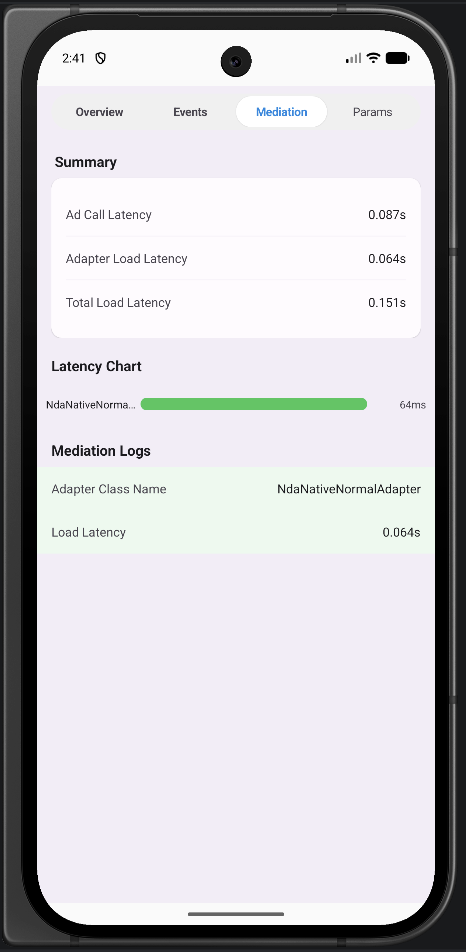
- Summary: 3 latency metrics
- Ad Call Latency: Time taken from ad server request to response
- Adapter Load Latency: Time taken to load the ad in the adapter
- Total Load Latency: Total time taken to load the ad
- Latency Chart: Visualizes the time taken per adapter as horizontal bar charts, with errors shown in red
- Mediation Logs: Detailed logs per adapter (adapter name, time taken, error code and message)
- Timeout: Displays timeout occurrence and timing
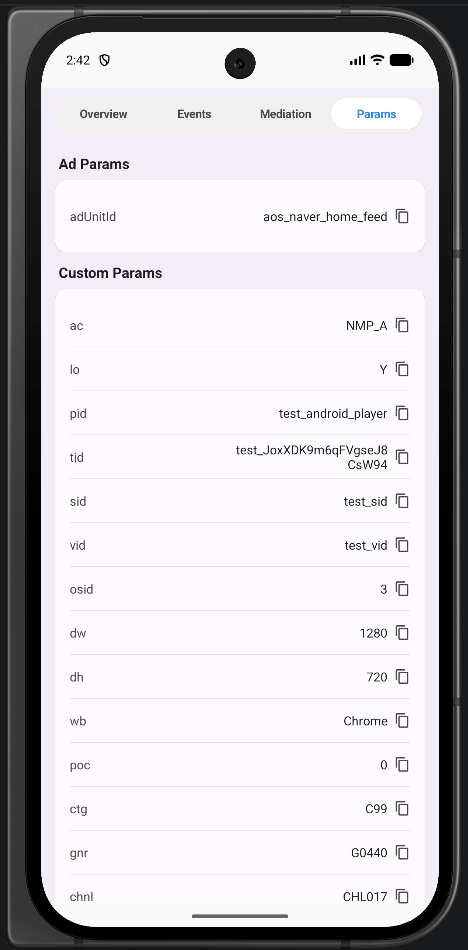
Params
Shows parameter information used in the ad request. You can check items such as Ad Params, Custom Params, timeout settings, test mode, SDK settings, user settings, and privacy settings.
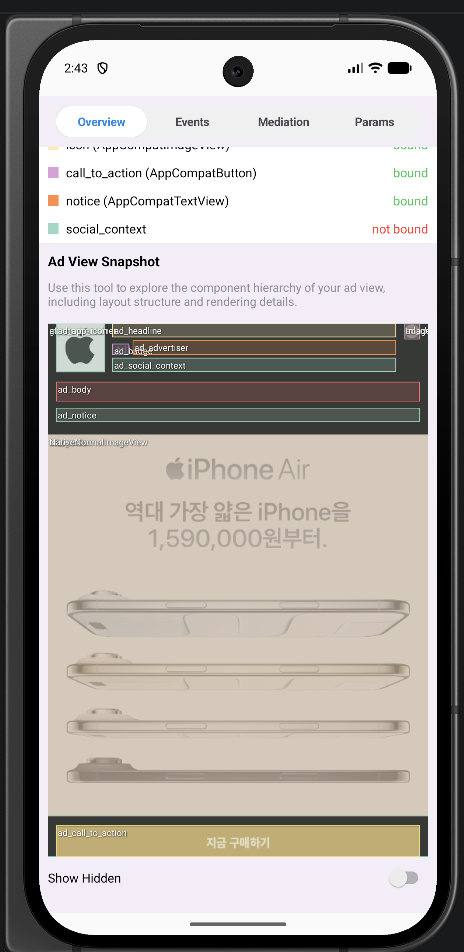
Ad View
Captures and displays the view hierarchy of the ad view. A screenshot of the ad view is shown with each view's area distinguished by color, and for native ads, binding verification results can also be checked.
SDK Tab
The SDK tab consists of 3 sub-tabs: SDK, Privacy, and Mediation Networks.
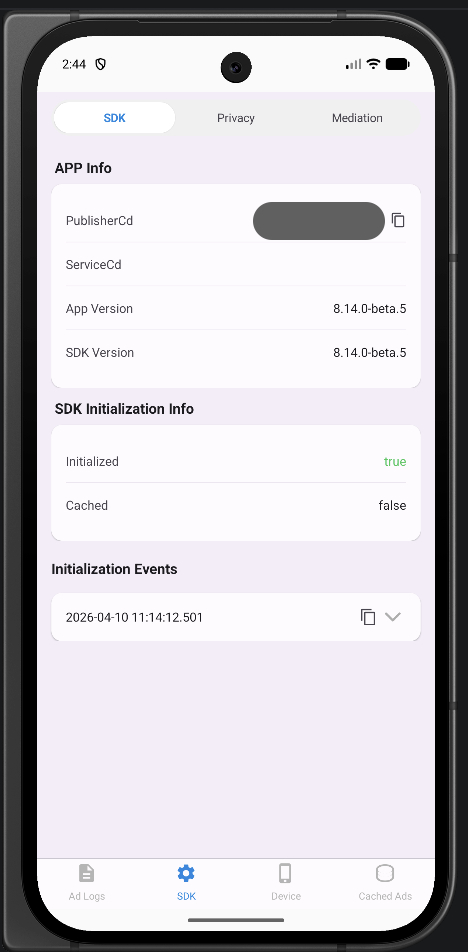
SDK Sub-tab
Shows SDK basic information and initialization status.
| Item | Description |
|---|---|
| App Info | Publisher CD, Service CD, app version, SDK version |
| Initialization | SDK initialization status (success/failure), cache usage |
| Init Events | Initialization event history for current and previous sessions |
Privacy Sub-tab
Shows advertising identifier and privacy-related settings.
| Item | Description |
|---|---|
| Advertising Identifier | Ad ID, Limit Ad Tracking, Disable Ad ID, App Set ID |
| GDPR | GDPR applicability, TC String |
| CCPA | US Privacy String |
| GPP | GPP String, GPP SID |
| COPPA | Child Directed Treatment, Under Age of Consent |
Mediation Networks Sub-tab
Shows adapter versions and status of integrated mediation networks.
Mediation network statuses are displayed as follows:
| Status | Description |
|---|---|
| Not Installed | Adapter not installed |
| Installed | Adapter installed |
| Ready | Initialization complete, ready for ad requests |
| Error | Initialization failed |
| Blocked | Deactivated by server configuration |
Device Tab
Shows device information that may affect ad requests.
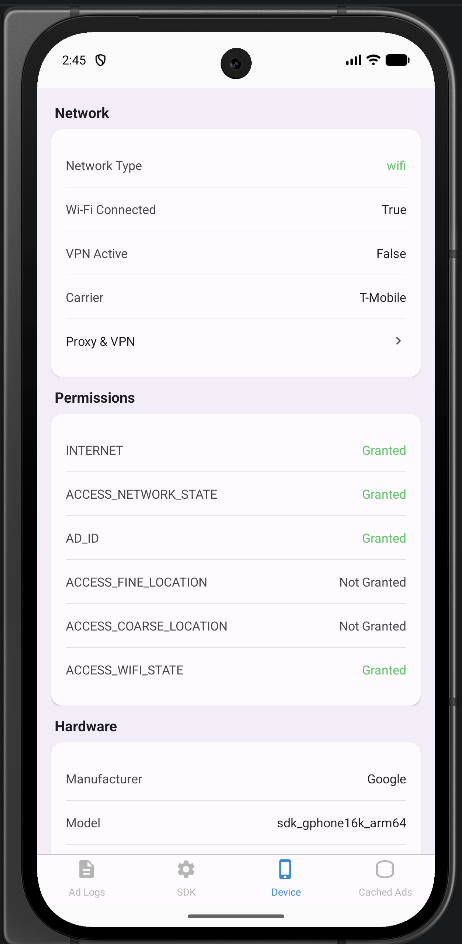
Network
| Item | Description |
|---|---|
| Network Type | Network type (Wi-Fi, Cellular, etc.) |
| WiFi Connected | Wi-Fi connection status |
| VPN Active | VPN usage status |
| Network Carrier | Carrier |
| Proxy/VPN Detail | Proxy and VPN detail settings |
Permissions
Checks the grant status of permissions related to ad SDK operations.
| Permission | Description |
|---|---|
| INTERNET | Internet access |
| ACCESS_NETWORK_STATE | Network state check |
| AD_ID | Advertising identifier access |
| ACCESS_FINE_LOCATION | Fine location |
| ACCESS_COARSE_LOCATION | Coarse location |
| ACCESS_WIFI_STATE | Wi-Fi state check |
Hardware
| Item | Description |
|---|---|
| Manufacturer | Manufacturer |
| Model | Device model |
| OS Version | Android version |
| API Level | API level |
| Screen Resolution | Screen resolution (px) |
| Screen Density | Screen density (ldpi/mdpi/hdpi, etc.) |
| Locale | Device language/region |
| Emulator | Whether running on an emulator |
| Rooted | Whether device is rooted |
App
| Item | Description |
|---|---|
| Package Name | Package name |
| App Version | App version |
| Installer Package | Installation source (Play Store, etc.) |
| User Agent | User Agent string |
| Target SDK | Target SDK version |
| Min SDK | Minimum SDK version |
Cached Ads Tab
Shows a list of disk-cached ads grouped by ad unit ID.
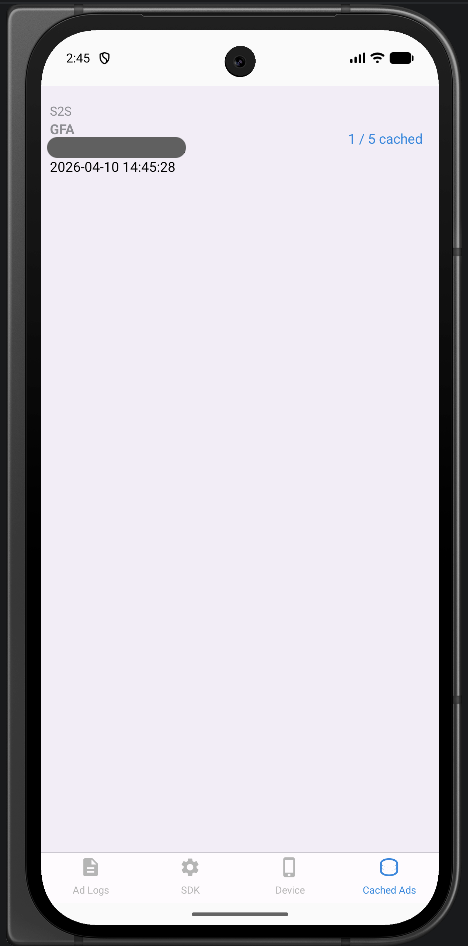
Each cached ad can be selected to view detailed information.
| Item | Description |
|---|---|
| File Name | Cache file name |
| File Size | Cache file size |
| Creation Time | Time of caching |
| Expiration Time | Cache expiration time |
| Total Asset Size | Total size of assets such as images/videos |
| Raw JSON | Raw cached ad response |
| Native Assets | Native ad asset list (URL, size) |
Individual cache files can also be selectively deleted.
For more details about the ad caching feature, refer to the Ad Caching guide.
Export / Import Logs
Export
You can export collected logs as a .zip file through the share button at the top right of Ad Debugger.
You can individually select which ad logs to export, and the exported file can be useful when reporting ad-related issues.
Import
You can reload a previously exported .zip file to reproduce logs.
In import mode, the top of the screen indicates that it is imported data, and you can return to live log mode through the reset button.